Key Points
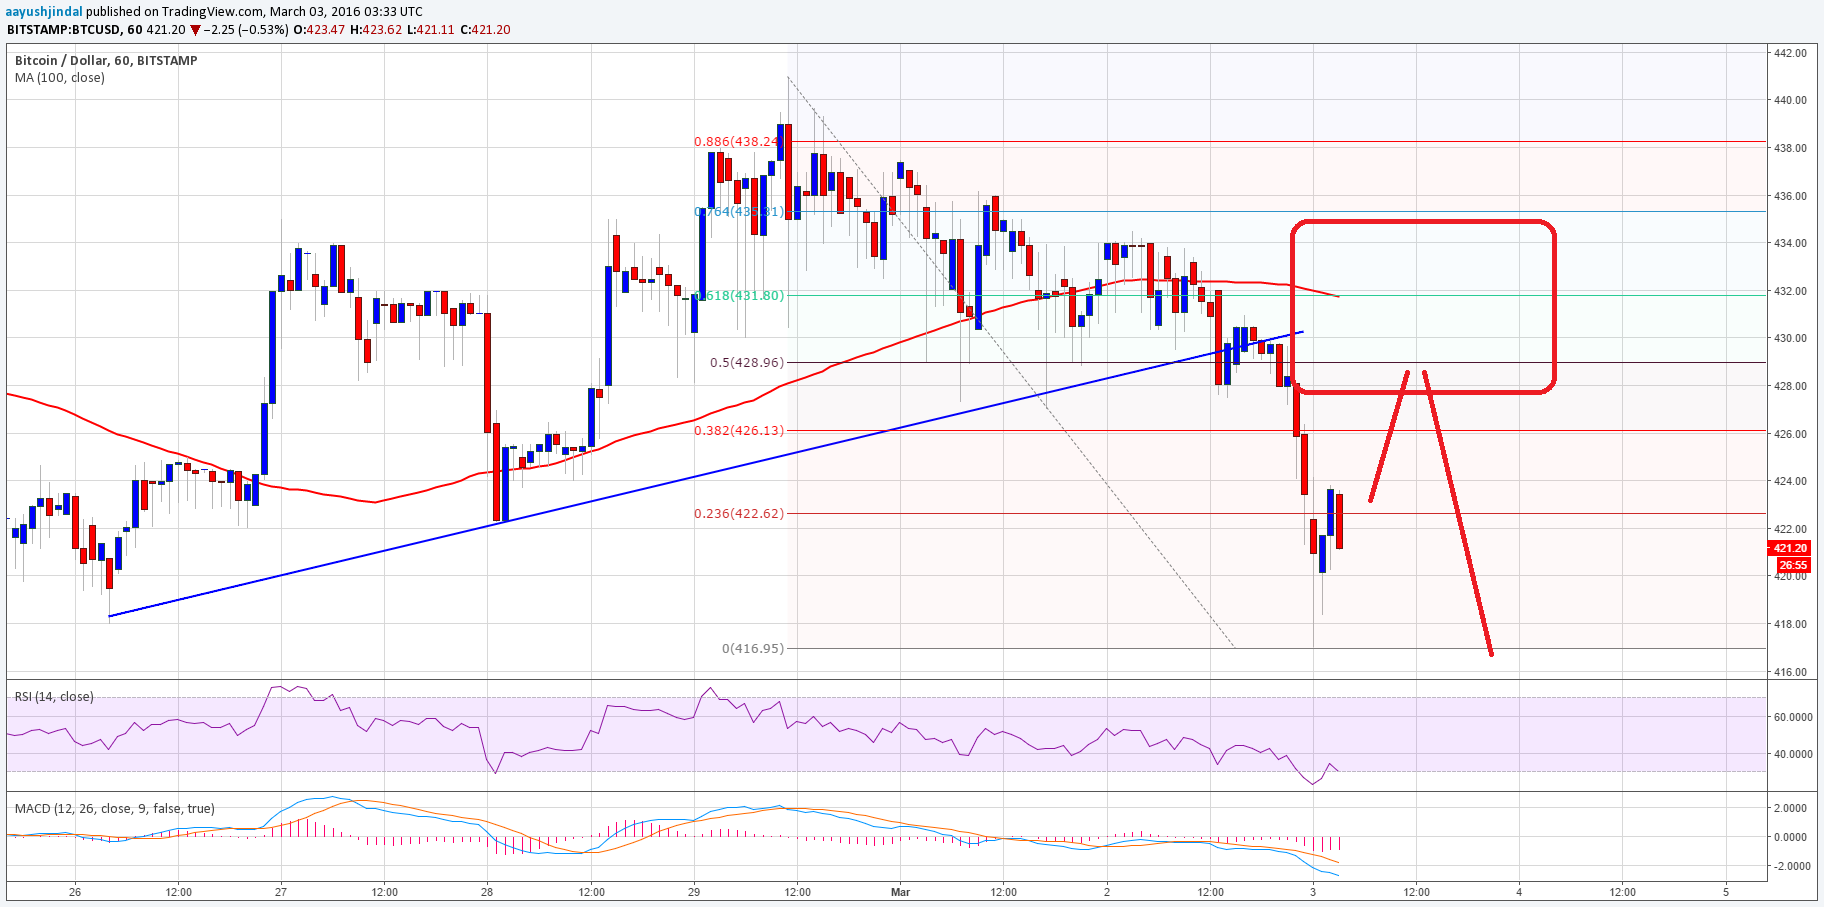
- Bitcoin price after trading in a range for some time finally broke down and traded lower.
- Yesterday’s highlighted bullish trend line on the hourly chart (data feed from Bitstamp) was broken to clear the way for more losses.
- The price traded as low as $416 and any correction from the current levels may find sellers on the upside.
Bitcoin price finally moved down and traded below the 100 hourly simple moving average to encourage sellers to gain control.
Bitcoin Price – Sell Rallies?
Bitcoin price failed to move higher, and finally sellers had the upper hand. There was a nice downside reaction, as the price closed below yesterday’s highlighted bullish trend line on the hourly chart (data feed from Bitstamp). The downside move was aggressive, and as a result, the price also moved below the 100 hourly simple moving average. It means sellers managed to take the price below a major support area, and might take it further down in the near term.
The price traded as low as $416 where there were a few bids. It is currently correcting higher, and trading near the 23.6% Fib retracement level of the last drop from the $440 high to $416 low. Any further gains may take the price towards the broken trend line, which might act as a resistance moving ahead. The same trend line is also coinciding with the 50% Fib retracement level of the last drop from the $440 high to $416 low.
Moreover, the 100 hourly simple moving average (data feed from Bitstamp) is also positioned on the upside. All in all there is a major resistance formed near $425-30 area.
Looking at the technical indicators:
Hourly MACD – The hourly MACD is in the bearish zone, suggesting sellers are in charge.
RSI (Relative Strength Index) – The hourly RSI is around the oversold area, calling for a minor correction.
Intraday Support Level – $415
Intraday Resistance Level – $430
Charts from Bitstamp; hosted by Trading View
