Key Highlights
- Ripple price surged higher against the US dollar, and even traded above the $0.008000 levels.
- There was a sharp spike in the price, suggesting that buyers were in control during the past couple of sessions
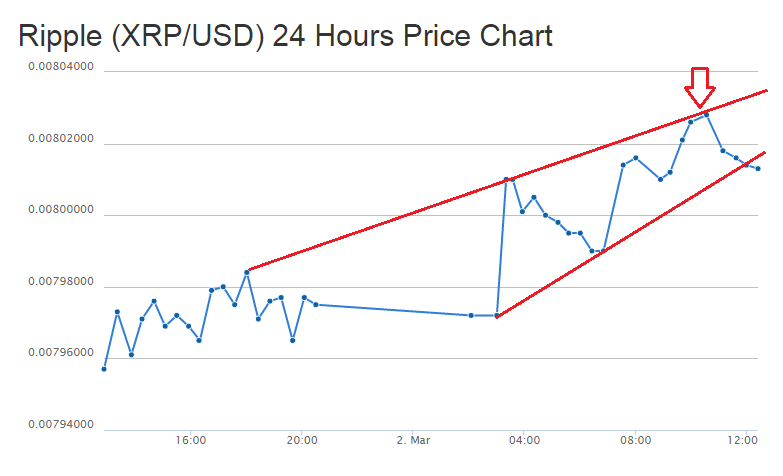
- There was a contracting triangle pattern formed on the hourly chart of Ripple price (provided as CoinGecko), which looks like broken recently.
Ripple price moved higher intraday, and it looks like there are chances of it gaining more traction in the near term.
Ripple Price – Buy dips?
Ripple price climbed higher against the US dollar, as buyers decimated sellers to take the price above $0.008000. A new high as set as $0.008028 where sellers appeared and pushed the price down. There was an interesting contracting triangle pattern formed on the hourly chart of Ripple price (provided as CoinGecko), which was just broken.
If the highlighted triangle trend line break is real, then there is a chance of a minor correction in the short term. The price is currently near the 23.6% Fib retracement level of the last leg from the $0.007965 low to $0.008028 high. There is a chance of a dip towards the $0.008000 levels, which may act as a major support moving ahead. The stated level is also aligned with the 50% Fib retracement level of the last leg from the $0.007965 low to $0.008028 high.
On the upside, the broken trend line may act as a minor resistance area. The most important resistance is around the last swing high of $0.008028. The mentioned level must be cleared by the bulls if they have to take the price towards $0.008100.
Looking at the indicators:
Hourly MACD – The MACD is in the bearish zone, which is a sign of a correction in the near term.
Hourly RSI – The RSI is just below the 50 level, which is not a good sign for the bulls.
Intraday Support Level – $0.008000
Intraday Resistance Level – $0.008028
Charts Courtesy: Coingecko
