
Key Highlights
- Ripple price is trading down, and was seen under a continuous bearish pressure against the US Dollar today.
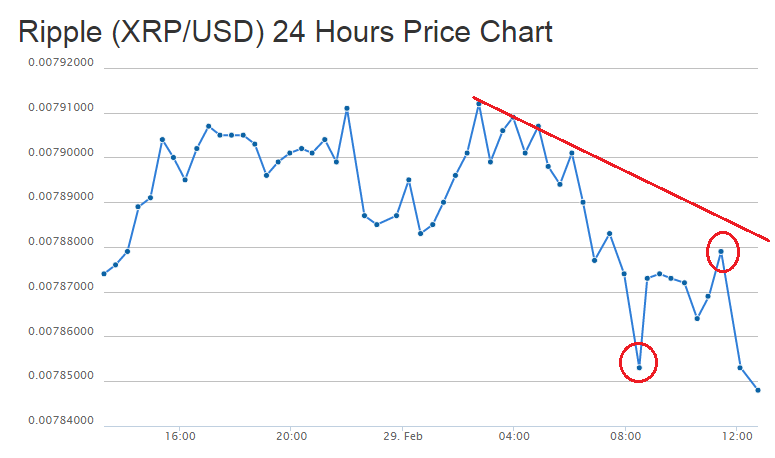
- There is a bearish trend line formed on the hourly chart of Ripple price (provided as CoinGecko), which acted as a mover for losses.
- The price is currently trading near $0.00785 where it may find bids for a minor correction.
Ripple price broke down today and was down from $0.00791 to $0.00785. More losses are possible if sellers remain in control.
Ripple Price – Sell Rallies?
Ripple price struggled throughout the day, and every minor correction towards the upside was sold aggressively. There was a downside move taking the price down towards the $0.00785 level. There is a bearish trend line formed on the hourly chart of Ripple price (provided as CoinGecko), which stalled gains on a few occasions and acted as a resistance.
The price once recovered, but the upside was stalled near the 50% Fib retracement level of the last drop from the $0.00791 high to $0.007853 low. The price traded back down, and broke $0.007853 to set a new low as $0.007848. If the price attempts to correct higher once again, then the 38.2% Fib retracement level of the last drop from the $0.00791 high to $0.007848 low may act as a resistance. The most important hurdle is around the $0.007880 level, followed by the highlighted bearish trend line and resistance area.
On the downside the $0.007848 low is a short-term support. A break below it might take the price towards the $0.007840 level.
Looking at the indicators:
Hourly MACD – The MACD is in the bearish zone, and calling for more downsides moving ahead.
Hourly RSI – The RSI is just below the 50 level, which is also a bearish sign for the sellers in the short term.
Intraday Support Level – $0.007848
Intraday Resistance Level – $0.007880
Charts Courtesy: Coingecko