SEI trades in a falling wedge pattern, with analysts eyeing a breakout toward $0.34 amid ETF filing and network growth.
Sei (SEI) has shown early signs of recovery after a recent pullback, gaining over 2% on Tuesday’s trading session. The token is currently trading within a falling wedge structure, a pattern that often signals a potential bullish breakout. Analysts suggest that a breakout from this pattern could drive SEI toward $0.34, which represents a possible 16% upside.
ETF Filing Boosts Institutional Interest
The SEI market received attention after 21Shares submitted an S-1 filing with the US Securities and Exchange Commission. This filing, made on Friday, comes shortly after Canary Capital also showed interest in launching a similar fund. Such applications indicate growing institutional involvement around SEI, which has strengthened investor sentiment.
The filing arrives at a time when traders are looking for new catalysts to drive activity in altcoins. While approval is not guaranteed, the attempt itself reflects a rising level of recognition from investment firms. Market observers have noted that institutional participation often improves liquidity and market depth.
On-Chain Growth Supports Price Recovery
Sei Network reported a sharp rise in weekly active addresses, which have grown by 500% in the past six months. The project confirmed that addresses exceeded 5 million for the second straight week, suggesting wider adoption of its ecosystem. This growth signals steady engagement from users who continue to interact with the network.
Data from DeFiLlama shows that Sei’s Total Value Locked (TVL) reached $565.42 million on Tuesday, up from $559.35 million a day earlier. A consistent increase in TVL indicates that more funds are being committed to decentralized applications on the network. This metric is often used by traders to measure ecosystem strength and utility.
SEI Technical Indicators Show Mixed Momentum
On the daily chart, SEI has rebounded from the lower Bollinger Band, avoiding a fall to the 38.2% Fibonacci level at $0.2524. The sideways movement of the Bollinger Bands points to a phase of low volatility, but the lower band is providing support. If the recovery extends, SEI may move toward the 50% Fibonacci retracement level at $0.3097.
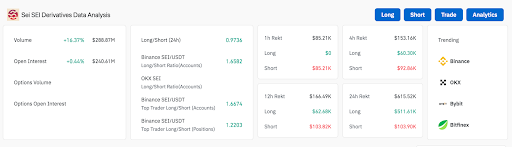
CoinGlass data shows that Open Interest in SEI futures has declined to $233.28 million from $245.17 million on Monday. This drop suggests traders are reducing exposure and adopting a wait-and-see approach in the near term. The long-to-short ratio has fallen to 0.9826 as taker sell volume has moved above 50%.
Momentum indicators also suggest caution, with the MACD and its signal line trending downward. The Relative Strength Index is currently at 43, which places it below the neutral level of 50. A close below the $0.2524 support could push SEI toward the $0.2000 level, while a breakout from the wedge structure could target $0.34.

