
Solana trades near $71 as analysts watch $80 resistance, $66 liquidation risk, and a possible $50 washout before recovery.
Solana is trading near $71.28 after losing a key technical level on the daily chart. The move has kept SOL below its main recovery zone.
Analysts are now split on whether Solana is forming a long-term accumulation range. Some expect one more drop before the next major recovery phase begins.
One market analyst said SOL could briefly fall toward the $50 region later this year. The same outlook also sees a possible return toward new highs by late 2027.
Meanwhile, another trader said he is short $15 million worth of SOL. He cited crowded long positions, fading momentum, and liquidation risk near lower levels.
Solana Price Holds Below Key Fib Support
Solana is currently trading below the $80.38 Fibonacci support level shown on the daily chart.
This level has now become an important resistance area for short-term buyers. A move back above it could improve the current technical setup.
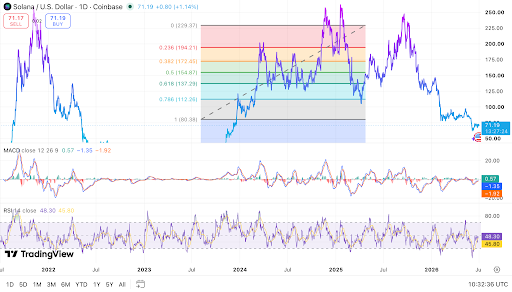
The next recovery zone sits between $80 and $90, where sellers may remain active.
If SOL clears that area, traders may watch $112.26 as the next upside level. Further resistance appears near $137.29 and $154.87 on the chart.
However, the current structure still shows weak price action after a broad decline.
SOL remains far below its previous 2025 highs, which were above $200. Because of that, traders are waiting for stronger confirmation before calling a recovery.
Analyst Sees Possible Drop Toward $50
One analyst said Solana may enter a lengthy accumulation phase over the next year.
Under that view, SOL could see one final capitulation below current lows. The analyst linked that possible move to a cycle bottom setup.
I wouldn't be surprised to see something like this play out for Solana over the next year.
A lengthy accumulation phase.
One final capitulation below the current lows to mark the cycle bottom.
Then the road back toward new highs into the end of 2027.
I think the worst… pic.twitter.com/ROkqbfTXyp
— Ardi (@ArdiNSC) June 27, 2026
The lower acceptance cloud on the chart sits just above the $50 region. The analyst said a brief move below that area should not be ruled out.
He compared that type of move with Solana’s 2022 market structure. At the same time, the analyst said the worst downside may already be behind Solana.
He described the lower blue cloud as a long-term value area for the next cycle. Still, the forecast depends on market conditions and future buyer demand.
Read Also:
Solana Raises New Stake Account Minimum to 1 SOL After SIMD-0490 Update Now
Short Seller Warns of Leverage Risk
A separate trader said he is holding a $15 million short position against SOL.
He said the trade is based on leverage, crowded positioning, and market reflexivity. The trader also said the short does not reflect a negative view of Solana itself.
Why I’m short $15M worth of $SOL:
The trade isn’t about hating Solana. It’s about understanding reflexivity. Ansem has undeniable influence, and alongside Mert and a large part of CT, he helped build one of the strongest narratives this cycle. But the more crowded a trade… pic.twitter.com/6Tok7UbZyU
— Matter (@Mattertrades) June 27, 2026
According to Matter, heavy long positioning could become a risk if momentum weakens.
The trader pointed to the $66 area as a zone where liquidations may build. If forced selling increases, he said SOL could revisit the $40 range.
Technical indicators currently show a mixed setup for Solana. The MACD histogram has turned positive, but momentum remains weak overall.
Meanwhile, RSI sits near 48, showing neutral conditions rather than strong buying pressure.


Leave a Reply
You must be logged in to post a comment.