
- Solana price started a strong increase above the $88.00 resistance against the US Dollar.
- The price is now trading above $100 and the 55 simple moving average (4 hours).
- There is a connecting bullish trend line forming with support near $100 on the 4-hour chart of the SOL/USD pair (data feed from Coinbase).
- The pair must clear $115 and $120 to continue higher in the near term.
Solana price is trading in a positive zone above $100 against the US Dollar, like Bitcoin. SOL could extend its rally toward the $140 resistance.
Solana (SOL) Price Analysis
SOL price remained in a bullish zone above the $88 and $90 support levels. The bulls were active near the $90 zone. A base was formed, and the price started a decent increase above the $100 level.
There was a push above the $105 level and the 55 simple moving average (4 hours). The pair even climbed above the $120 level. A high was formed near $125.97 and the price is now consolidating gains. It is trading near the 23.6% Fib retracement level of the upward move from the $67.00 swing low to the $125.07 high.
SOL is now trading above $100 and the 55 simple moving average (4 hours). There is also a connecting bullish trend line forming with support near $100 on the 4-hour chart of the SOL/USD pair.
On the upside, an immediate resistance is near the $115 level. The next major resistance is near the $120 zone. Any more gains might send SOL price toward the $125 resistance zone, above which the price could accelerate higher. The next major resistance sits near the $140 level.
On the downside, initial support is near the $105 level. A downside break below the $105 support level might push the price toward the trend line zone.
Any more losses might call for a test of the 50% Fib retracement level of the upward move from the $67.00 swing low to the $125.07 high at $95.
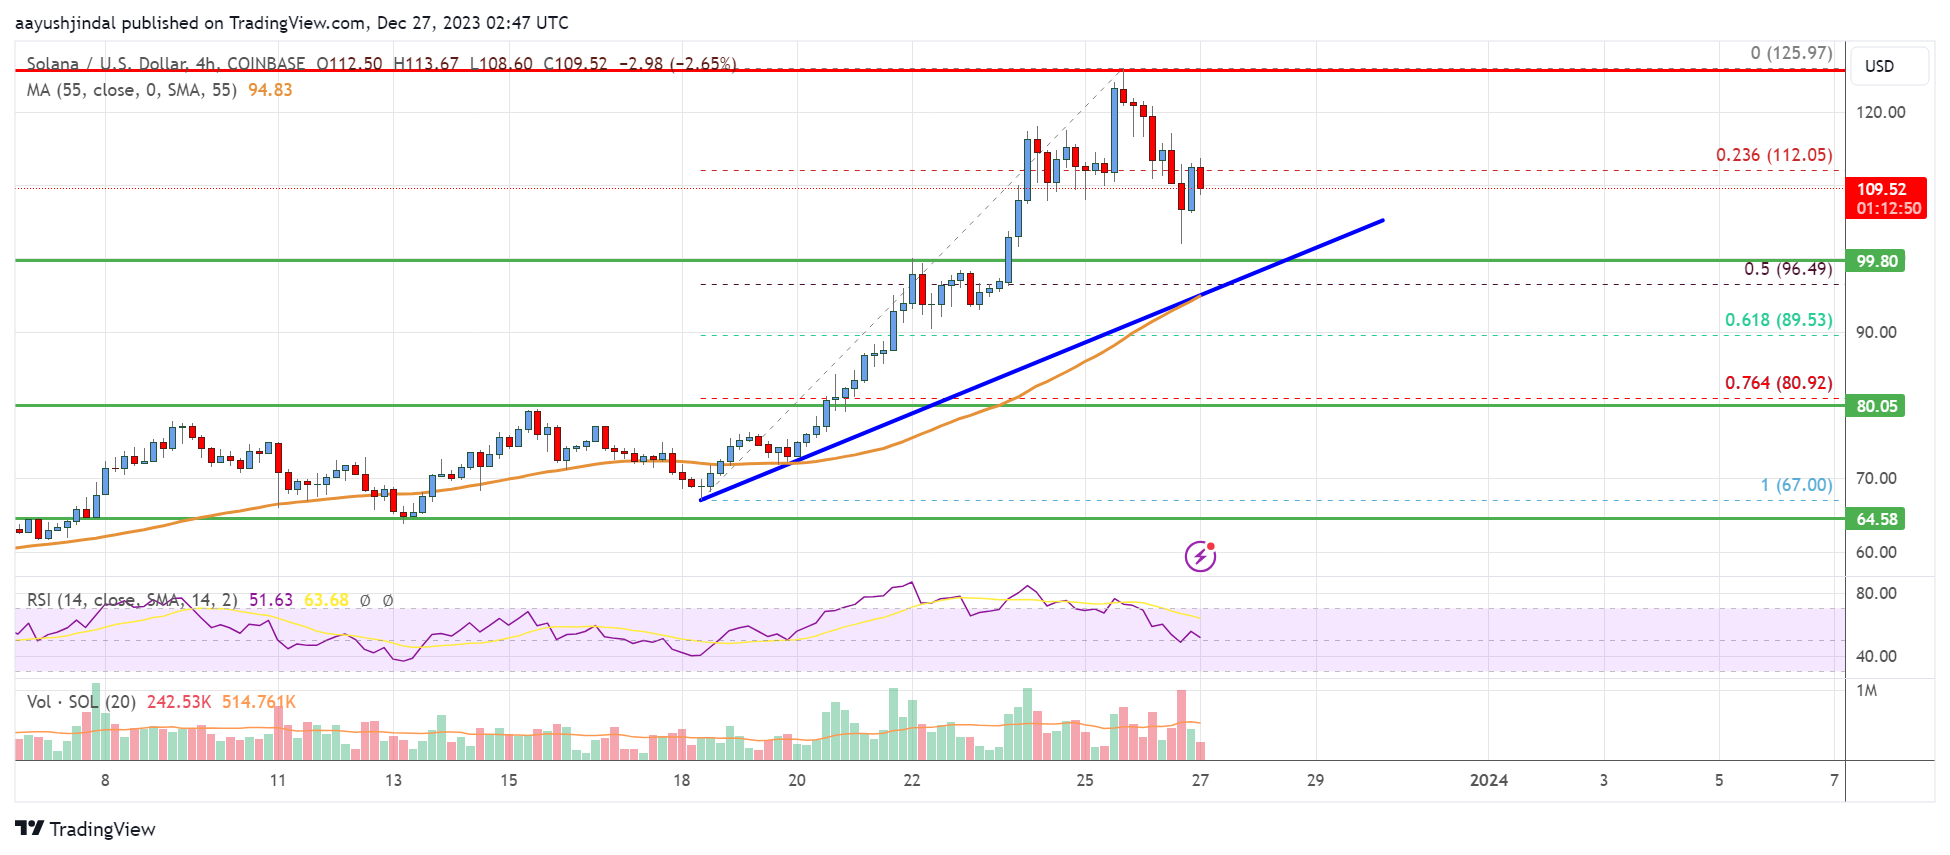
Looking at the chart, Solana price is clearly trading above $100 and the 55 simple moving average (4 hours). Overall, the price must clear $115 and $120 to continue higher in the near term.
Technical Indicators
4 hours MACD – The MACD is now losing momentum in the bullish zone.
4 hours RSI (Relative Strength Index) – The RSI is now above the 50 level.
Key Support Levels – $105 and $100.
Key Resistance Levels – $115, $120, and $125.


