- Stellar lumen price started a steady decline from the $0.1180 resistance zone against the US Dollar.
- XLM price declined below the $0.1080 support level and the 55 simple moving average (4-hours).
- There is a key declining channel forming with resistance near $0.1050 on the 4-hours chart (data feed via Kraken).
- The pair could extend its decline towards the $0.0950 support before it might start a fresh increase.
Stellar lumen price is slowly moving lower below $0.1050 against the US Dollar, while bitcoin is stable. XLM price is likely to resume its upward move towards $0.1200 once the current correction is complete.
Stellar Lumen Price Analysis (XLM to USD)
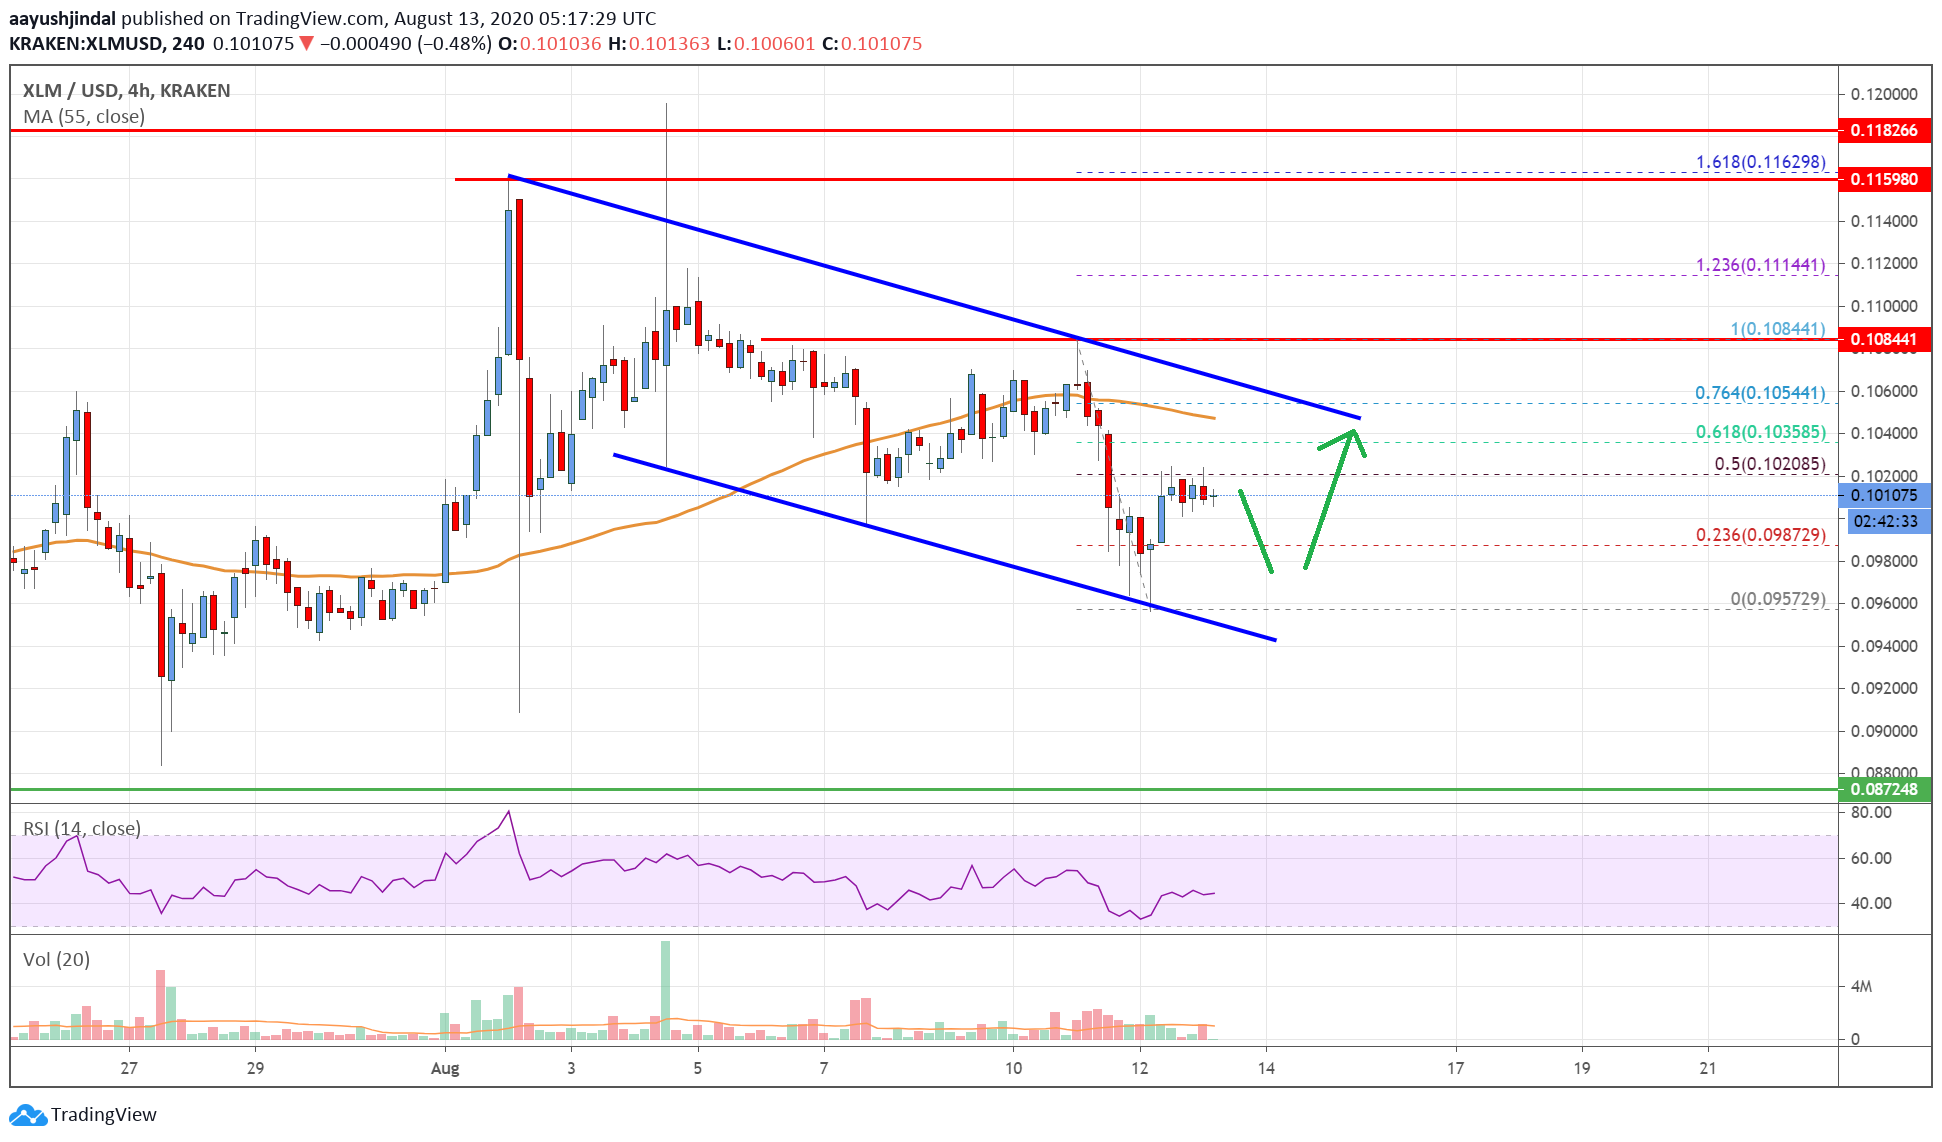
This past week, stellar lumen price started a steady downward move from well above $0.1150 against the US Dollar. The XLM/USD pair broke the $0.1100 support level and settled below the 55 simple moving average (4-hours).
The downward move was such that the price traded below the $0.1050 support level. It traded as low as $0.0957 and the price is currently correcting higher. There was a break above the $0.0980 resistance.
There was a break above the 23.6% Fibonacci retracement level of the recent decline from the $0.1084 high to $0.0957 low. The price is currently facing a major hurdle near the $0.1020 level.
It seems like the 50% Fibonacci retracement level of the recent decline from the $0.1084 high to $0.0957 low is acting as a major resistance for the bulls. The first major hurdle is seen near the $0.1050 level or the 55 simple moving average (4-hours).
There is also a key declining channel forming with resistance near $0.1050 on the 4-hours chart. If there is a break above the channel resistance and the 55 SMA, the price could start a fresh increase above the $0.1080 resistance zone.
The next major resistance is near the $0.1120 level, above which the price might continue to rise towards the $0.1200 barrier. Conversely, there is a risk of a downside correction below the $0.1000 level. The main support on the downside is near the $0.0950 level, where the bulls are likely to take a stand.

The chart indicates that XLM price is clearly declining steadily below $0.1050. Therefore, the price could extend its decline towards the $0.0950 support before it might start a fresh increase.
Technical Indicators
4 hours MACD – The MACD for XLM/USD is slowly losing pace in the bullish zone.
4 hours RSI – The RSI for XLM/USD is still below the 50 level, but with a flat structure.
Key Support Levels – $0.1000 and $0.0950.
Key Resistance Levels – $0.1020, $0.1050 and $0.1120.


Leave a Reply
You must be logged in to post a comment.