- Stellar lumen price started a fresh decline from the $0.114 resistance zone against the US Dollar.
- XLM price is now trading above $0.1040 and the 55 simple moving average (4-hours).
- There was a break above a major bearish trend line with resistance near $0.1040 on the 4-hours chart (data feed via Kraken).
- The pair could start a major increase if there is a clear move above the $0.1080 resistance zone.
Stellar lumen price is trading below $0.1080 against the US Dollar, similar to bitcoin. XLM price must stay above the $0.1000 support to avoid more losses.
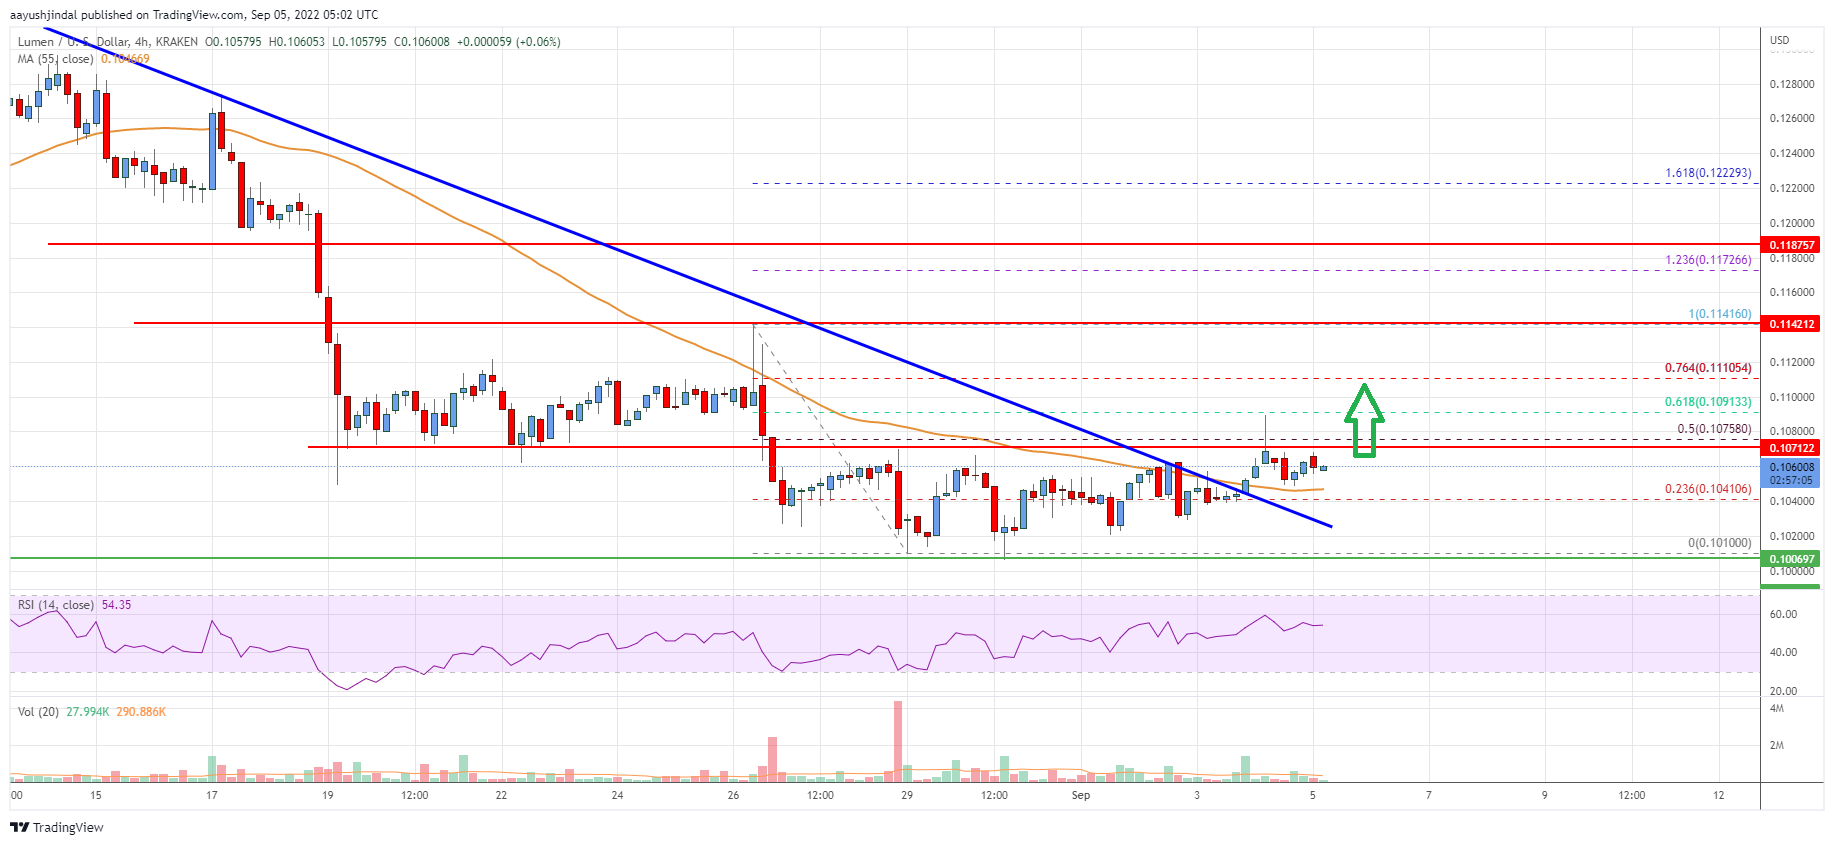
Stellar Lumen Price Analysis (XLM to USD)
This past week, stellar lumen price saw a bearish reaction below the $0.1080 support against the US Dollar. The XLM/USD pair traded below the $0.1050 support and the 55 simple moving average (4-hours).
It tested the $0.1010 support zone where the bulls emerged. A low was formed near $0.1010 and the price is now consolidating losses. There was a minor increase above the $0.1040 resistance. The price broke the 23.6% Fib retracement level of the recent decline from the $0.1140 swing high to $0.1010 low.
Besides, there was a break above a major bearish trend line with resistance near $0.1040 on the 4-hours chart. XLM is now trading above $0.1040 and the 55 simple moving average (4-hours).
On the upside, the price is facing resistance near the $0.1070 zone. It is near the 50% Fib retracement level of the recent decline from the $0.1140 swing high to $0.1010 low. The next major resistance is near the $0.1075 level. A clear move above the $0.1075 level might send the price towards the $0.1140 level. Any more gains could lead the price towards the $0.1200 level or even $0.1250.
An initial support on the downside is near the $0.1040 level. The main support is near the $0.1000 zone. Any more losses could lead the price towards the $0.0900 level in the near term, below which the price might even retest $0.0820.

The chart indicates that XLM price is now trading above $0.1040 and the 55 simple moving average (4-hours). Overall, the price could start a major increase if there is a clear move above the $0.1080 resistance zone.
Technical Indicators
4 hours MACD – The MACD for XLM/USD is losing momentum in the bearish zone.
4 hours RSI – The RSI for XLM/USD is now above the 50 level.
Key Support Levels – $0.1000 and $0.0920.
Key Resistance Levels – $0.1080, $0.1075 and $0.1140.


Leave a Reply
You must be logged in to post a comment.