- Stellar lumen price is attempting a fresh increase from the $0.2500 zone against the US Dollar.
- XLM price is now trading above $0.2800 and the 55 simple moving average (4-hours).
- There is a key rising channel forming with support near $0.2930 on the 4-hours chart (data feed via Kraken).
- The pair could start a steady upward move if there is a clear break above $0.3000.
Stellar lumen price is trading in a positive zone above $0.2800 against the US Dollar, similar to bitcoin. XLM price must settle above $0.3000 to continue higher.
Stellar Lumen Price Analysis (XLM to USD)
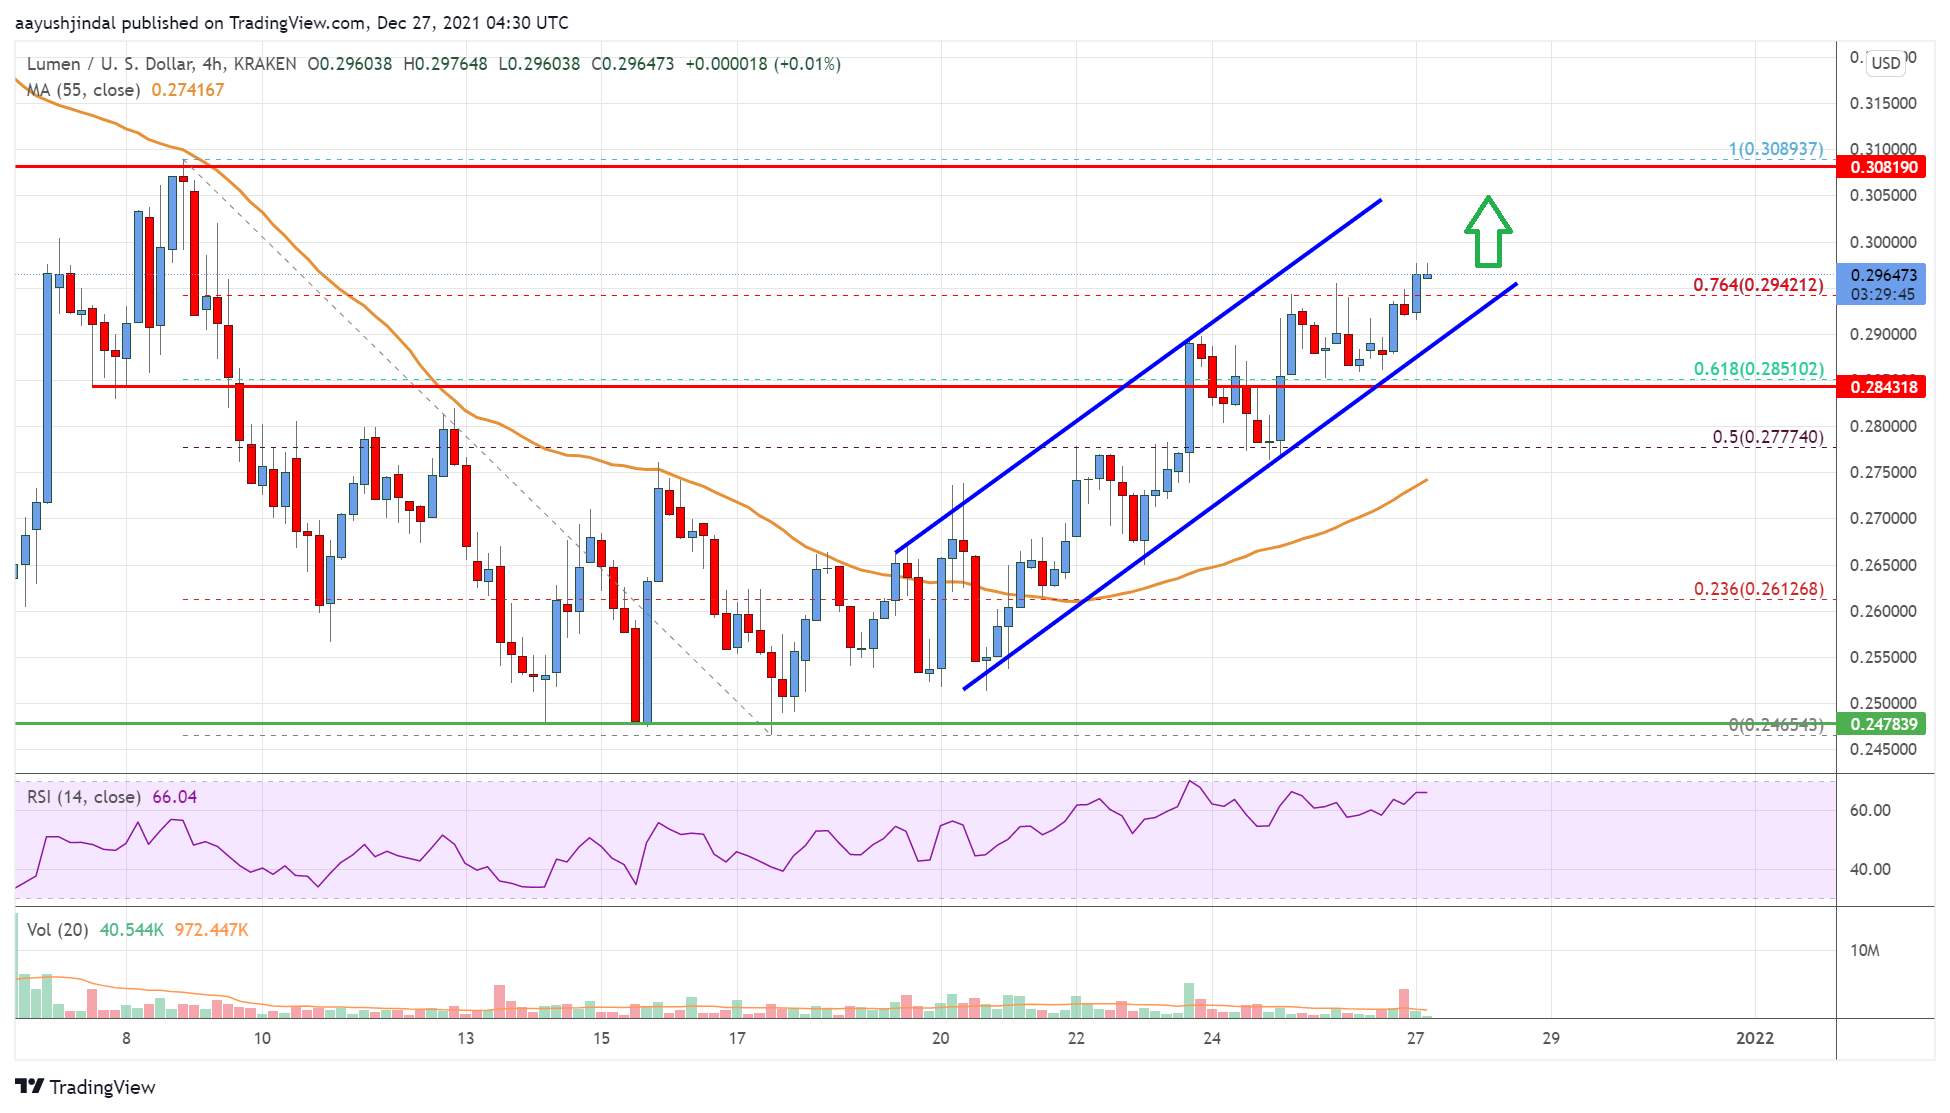
After forming a base above the $0.2480 level, stellar lumen price started a fresh increase against the US Dollar. The XLM/USD pair traded above the $0.2650 level to move into a positive zone.
The pair traded above the 50% Fibonacci retracement level of the downward move from the $0.3090 swing high to $0.2465 low. It is now trading above $0.2800 and the 55 simple moving average (4-hours). There is also a key rising channel forming with support near $0.2930 on the 4-hours chart.
The pair is trading above the 76.4% Fibonacci retracement level of the downward move from the $0.3090 swing high to $0.2465 low. An immediate resistance on the upside is near the $0.3000 level.
The next major resistance is now near $0.3080. If there is a clear break above the $0.3080 resistance zone, the price could start another steady increase. The next key resistance is near the $0.3200 level, above which the price could rise towards the $0.3500 level in the near term.
An immediate support is near the $0.2920 level. The main support is near $0.2800. A downside break below the $0.2800 support might call for more losses. The next major support is near the $0.2700 zone. Any more losses might send the price towards the $0.2500 level.

The chart indicates that XLM price is now trading above $0.2800 and the 55 simple moving average (4-hours). Overall, the price could start a steady upward move if there is a clear break above $0.3000.
Technical Indicators
4 hours MACD – The MACD for XLM/USD is slowly gaining momentum in the bullish zone.
4 hours RSI – The RSI for XLM/USD is now above the 50 level.
Key Support Levels – $0.2920 and $0.2800.
Key Resistance Levels – $0.3000, $0.3080 and $0.3200.


Leave a Reply
You must be logged in to post a comment.