- Stellar lumen price started a fresh decline from the $0.152 resistance against the US Dollar.
- XLM price is now trading below $0.1300 and the 55 simple moving average (4-hours).
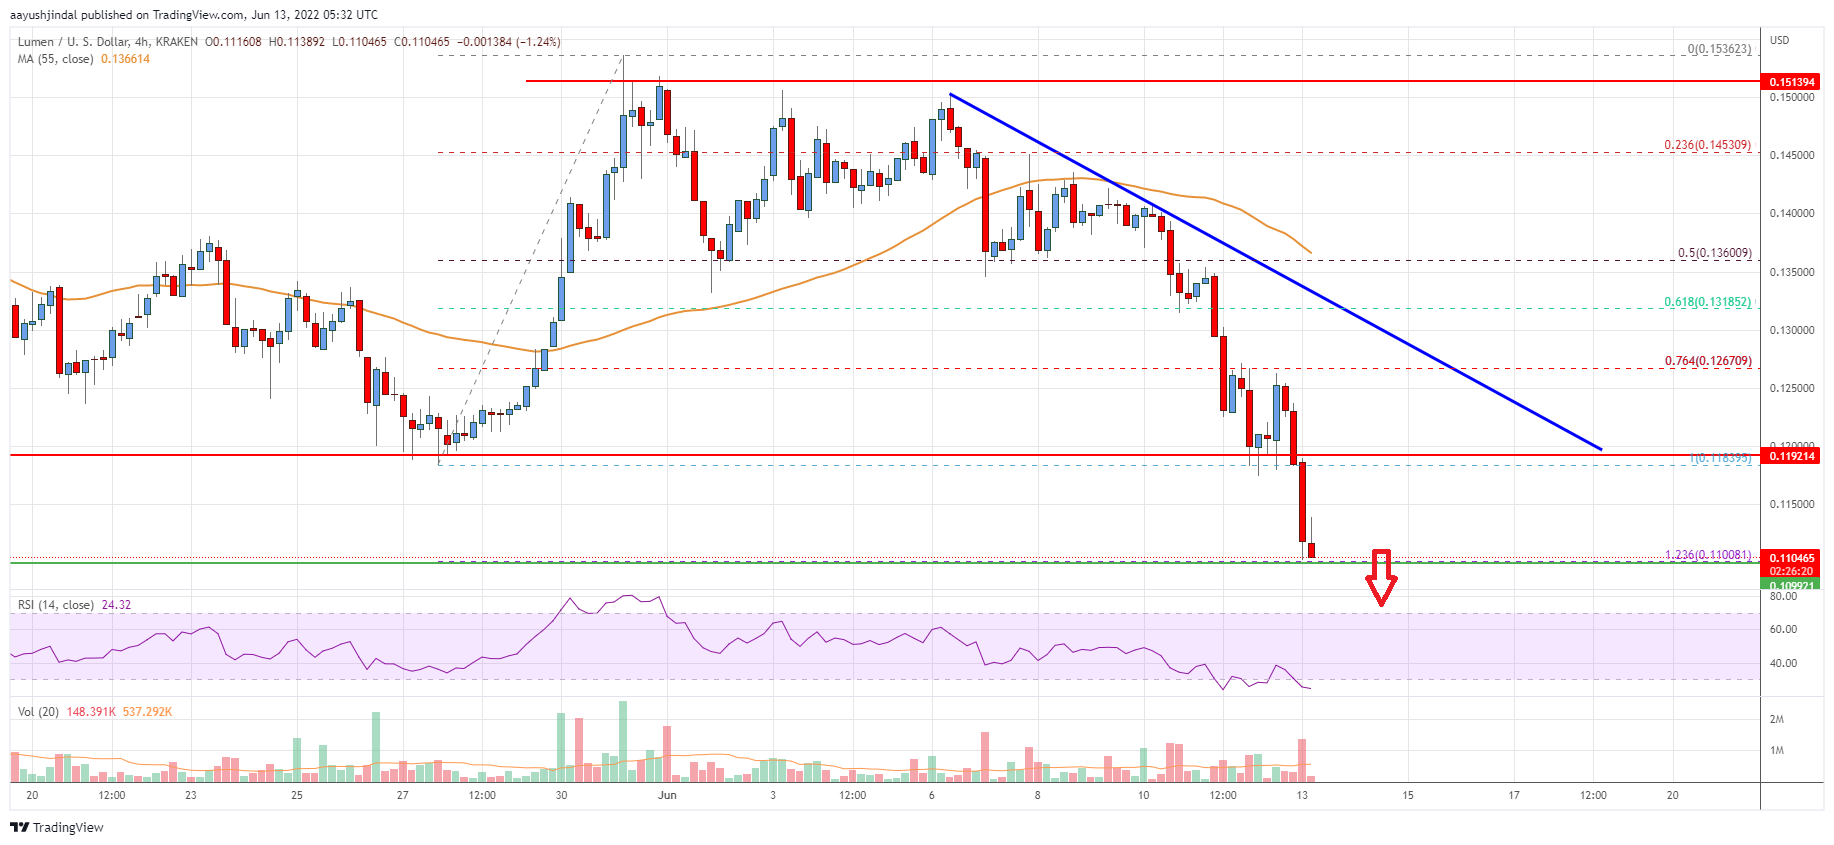
- There is a major bearish trend line forming with resistance near $0.1250 on the 4-hours chart (data feed via Kraken).
- The pair could continue to decline towards the $0.1000 support zone in the near term.
Stellar lumen price is trading well below $0.1400 against the US Dollar, similar to bitcoin. XLM price must stay above the $0.1000 support to avoid a larger decline.
Stellar Lumen Price Analysis (XLM to USD)
After a struggle near the $0.1520 level, stellar lumen price saw a fresh decline against the US Dollar. The XLM/USD pair traded below the $0.1400 support level to enter a bearish zone.
There was a clear move below the $0.1300 level and the 55 simple moving average (4-hours). The bears were able to push the price below the $0.1250 support zone. It even declined below the 76.4% Fib retracement level of the upward move from the $0.1183 swing low to $0.1536 high.
A low is formed near $0.1105 and the price is now consolidating losses. An initial support on the downside is near the $0.1100 level.
The stated support is near the 1.236 Fib extension level of the upward move from the $0.1183 swing low to $0.1536 high. The main support is near the $0.1000 zone. Any more losses could lead the price towards the $0.0850 level in the near term, below which the price might even test $0.080.
On the upside, the price is facing resistance near the $0.1150 zone. The next major resistance is near the $0.1200 level. There is also a major bearish trend line forming with resistance near $0.1250 on the 4-hours chart.
A clear move above the $0.1250 level might send the price towards the $0.1350 level. Any more gains could lead the price towards the $0.1400 level.

The chart indicates that XLM price is now trading below $0.1250 and the 55 simple moving average (4-hours). Overall, the price could continue to decline towards the $0.1000 support zone in the near term.
Technical Indicators
4 hours MACD – The MACD for XLM/USD is gaining momentum in the bearish zone.
4 hours RSI – The RSI for XLM/USD is now below the 30 level.
Key Support Levels – $0.1100 and $0.1000.
Key Resistance Levels – $0.1150, $0.1200 and $0.1250.


Leave a Reply
You must be logged in to post a comment.