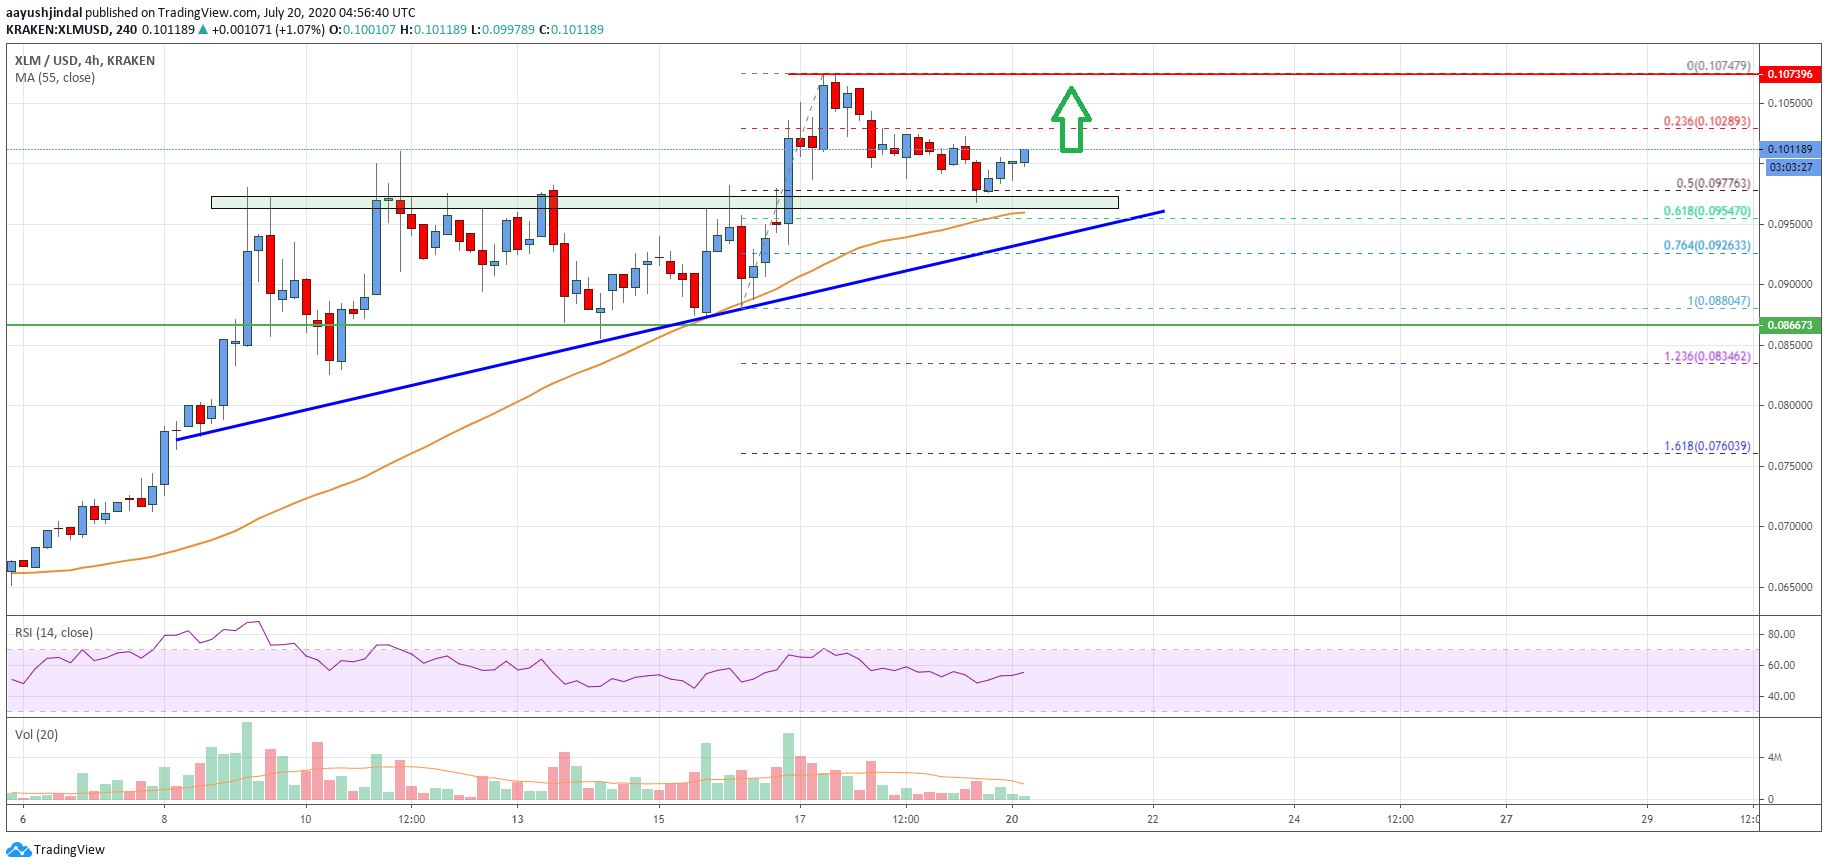
- Stellar lumen price recovered nicely after a sharp decline and settled above $0.0620 against the US Dollar.
- XLM price is currently consolidating above $0.0650 and the 55 simple moving average (4-hours).
- There is a crucial breakout pattern forming with resistance near $0.0670 on the 4-hours chart (data feed via Kraken).
- The pair could start a fresh rally if it breaks the $0.0670 and $0.0680 resistance levels.
Stellar lumen price is trading in a positive zone against the US Dollar and bitcoin. XLM price must stay above the $0.0650 support to start a strong increase towards $0.0700.
Stellar Lumen Price Analysis (XLM to USD)
After a sharp downside spike, stellar lumen price recovered steadily above the $0.0600 level against the US Dollar. The XLM/USD pair even climbed above the $0.0650 level and the 55 simple moving average (4-hours).
Finally, there was a break above the $0.0700 level, but the bulls failed to remain in action. There was a downside correction below the $0.0680 level. The price even declined below the 50% Fibonacci retracement level of the upward move from the $0.0629 swing low to $0.0706 high.
However, the $0.0650 support level is acting as a support along with the 55 simple moving average (4-hours). The 61.8% Fibonacci retracement level of the upward move from the $0.0629 swing low to $0.0706 high is also acting as a solid support.
It seems like there is a crucial breakout pattern forming with resistance near $0.0670 on the 4-hours chart. If there is a successful close above the $0.0670 and $0.0680 resistance levels, there are chances of a fresh rally.
In the mentioned case, the bulls are likely to aim a test of $0.0700. Any further gains could open the doors for a larger upward move towards the $0.0740 level in the near term.
Conversely, the price is likely to restart its decline below the $0.0650 support zone. If there is a proper close below the $0.0650 support level, the bears are likely to take control. The next major support is near the $0.0600 level.

The chart indicates that XLM price is clearly trading above a major support at $0.0650. Therefore, the price could start a fresh rally if it breaks the $0.0670 and $0.0680 resistance levels.
Technical Indicators
4 hours MACD – The MACD for XLM/USD is slowly gaining pace in the bullish zone.
4 hours RSI – The RSI for XLM/USD is still below the 50 level.
Key Support Levels – $0.0650 and $0.0600.
Key Resistance Levels – $0.0670, $0.0680 and $0.0700.


Leave a Reply
You must be logged in to post a comment.