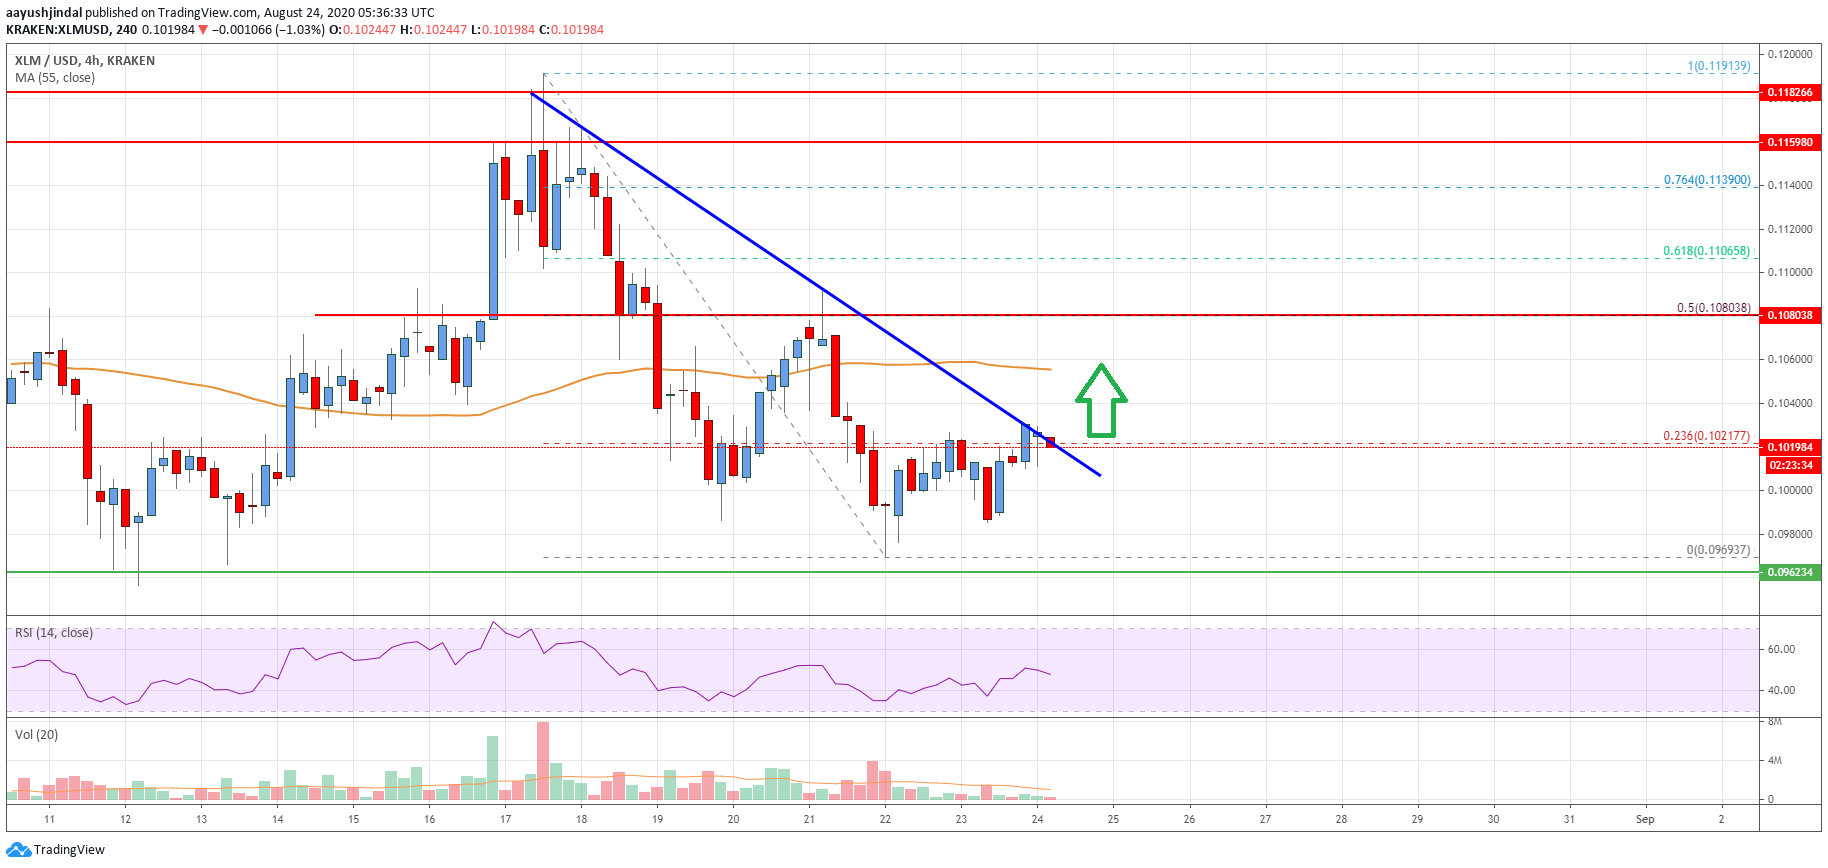
- Stellar lumen price is currently holding the $0.0980 and $0.1000 support levels against the US Dollar.
- XLM price is facing many hurdles near the 55 simple moving average (4-hours) and $0.1080.
- There is a key bearish trend line forming with resistance near $0.1024 on the 4-hours chart (data feed via Kraken).
- The pair could move into a bullish zone if it clears the $0.1050 and $0.1080 resistance levels.
Stellar lumen price is holding a couple of key supports against the US Dollar, similar to bitcoin. XLM price must clear the $0.1080 resistance to move into a positive zone.
Stellar Lumen Price Analysis (XLM to USD)
This past week, stellar lumen price started a steady decline from well above $0.1100 against the US Dollar. The XLM/USD pair broke the key $0.1080 pivot level to move into a bearish zone.
There was also a break below the $0.1000 support level and the price settled below the 55 simple moving average (4-hours). A low is formed near $0.0969 and the price is currently recovering higher. The price is trading above $0.1000, but it is facing a couple of key hurdles.
There is a key bearish trend line forming with resistance near $0.1024 on the 4-hours chart. The trend line is close to the 23.6% Fibonacci retracement level of the recent decline from the $0.1191 high to $0.0969 low.
The first major resistance is near the $0.1060 level and the 55 simple moving average (4-hours). The main resistance is still near the $0.1080 pivot level. It is close to the 50% Fibonacci retracement level of the recent decline from the $0.1191 high to $0.0969 low.
A successful break above the $0.1050 and $0.1080 resistance levels is must for a fresh increase in the near term. In the mentioned case, the price might continue to rise towards the $0.1200 resistance level.
Conversely, the price might fail to continue higher above $0.1040 or $0.1050. The main support is near the $0.0980 level, below which the price might continue to decline towards $0.0880 support.

The chart indicates that XLM price is clearly attempting an upside break above $0.1020. Overall, the price could move into a bullish zone if it clears the $0.1050 and $0.1080 resistance levels.
Technical Indicators
4 hours MACD – The MACD for XLM/USD is slowly gaining pace in the bullish zone.
4 hours RSI – The RSI for XLM/USD is currently rising and it is likely to settle above the 50 level.
Key Support Levels – $0.1000 and $0.0980.
Key Resistance Levels – $0.1040, $0.1050 and $0.1080.


Leave a Reply
You must be logged in to post a comment.