
- Stellar lumen price started a decent increase above the $0.2500 resistance against the US Dollar.
- XLM price is now trading above $0.2500 and the 55 simple moving average (4-hours).
- There is a key bullish trend line forming with support near $0.2700 on the 4-hours chart (data feed via Kraken).
- The pair is likely to start another increase if there is a break above the $0.2850 resistance.
Stellar lumen price is showing positive signs above $0.2500 against the US Dollar, similar to bitcoin. XLM price could gain pace if it clears the $0.2850 and $0.2950 levels.
Stellar Lumen Price Analysis (XLM to USD)
After testing the $0.2000 support zone, stellar lumen price started a fresh increase against the US Dollar. The XLM/USD pair broke the $0.2200 resistance level to move into a positive zone.
The price even rallied above the $0.2500 barrier and the 55 simple moving average (4-hours). The bulls were able to push the price above the $0.2800 level. A high was formed near $0.3033 before the price started a downside correction.
There was a break below the $0.2850 support level. A low is formed near $0.2684 and the price is now consolidating losses. It is testing the 23.6% Fibonacci retracement level of the recent decline from the $0.3033 high to $0.2684 low.
There is also a key bullish trend line forming with support near $0.2700 on the 4-hours chart. It is now facing resistance near $0.2850 zone. It is near the 50% Fibonacci retracement level of the recent decline from the $0.3033 high to $0.2684 low.
If there is a clear break above the $0.2850 resistance zone, the price could start another steady increase. The next key resistance is near the $0.2950 level. Any more gains could set the pace for a larger increase in the coming sessions towards $0.3200.
The next key resistance is near the $0.3500 level. If not, the price could extend losses below the trend line support and $0.2700. An immediate support is near the $0.2620 level. The main support is near $0.2540. Any more losses might call for a drop towards the $0.2200 support zone.
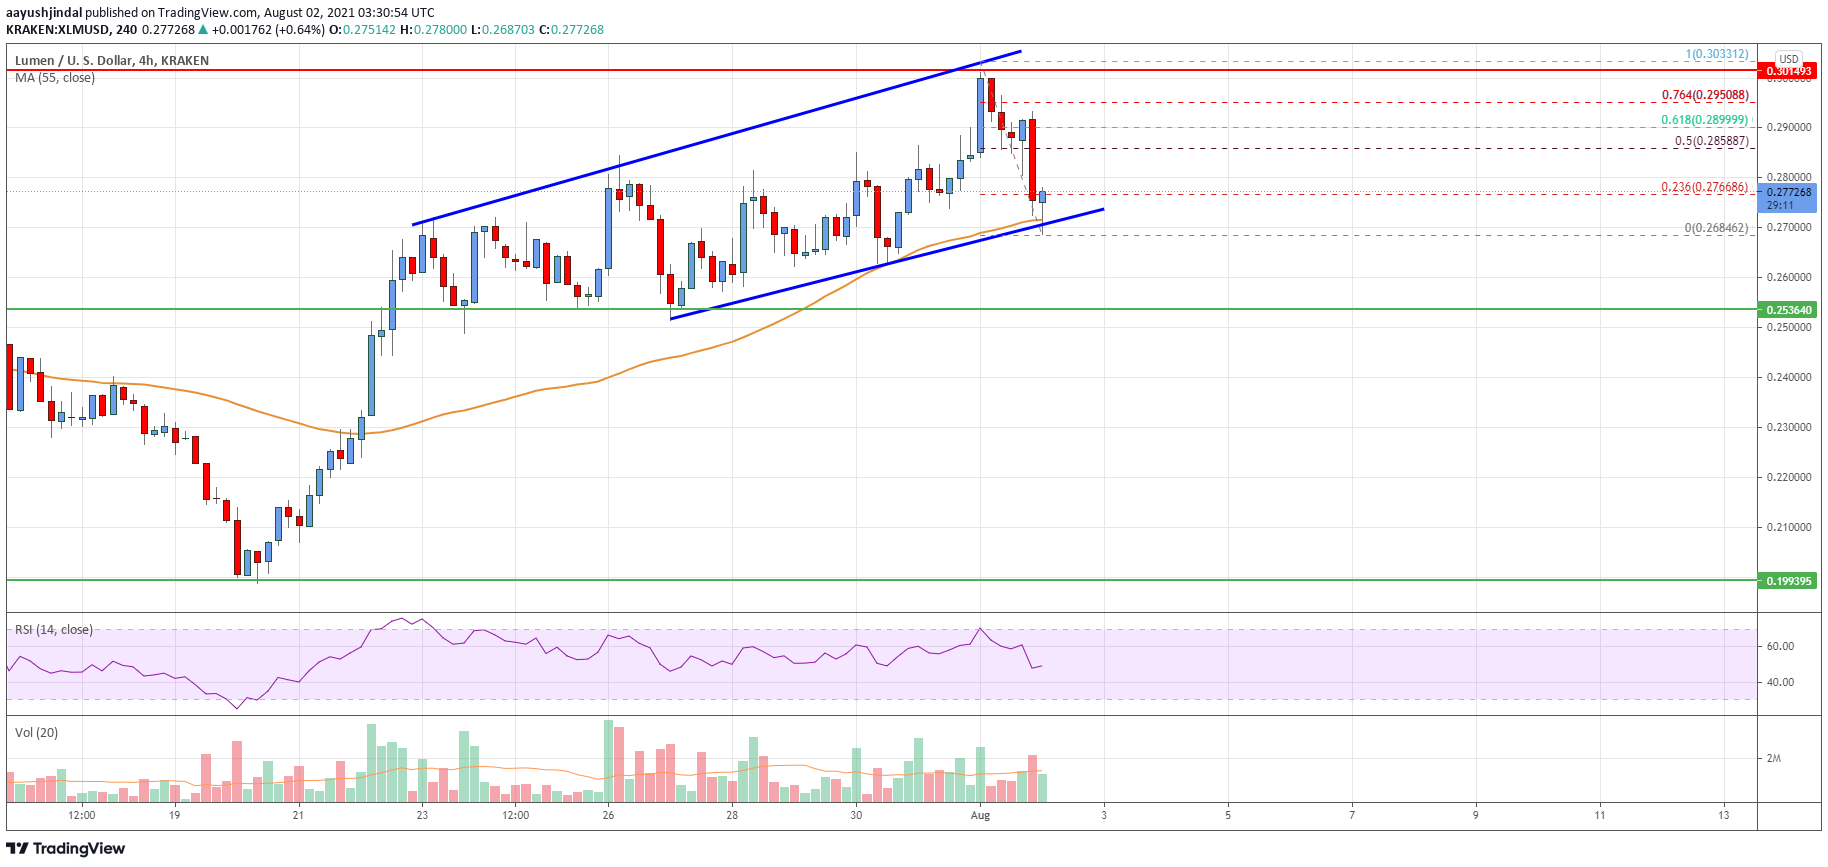
The chart indicates that XLM price now trading above $0.2500 and the 55 simple moving average (4-hours). Overall, the price is likely to start another increase if there is a break above the $0.2850 resistance.
Technical Indicators
4 hours MACD – The MACD for XLM/USD is slowly losing momentum in the bullish zone.
4 hours RSI – The RSI for XLM/USD is currently near the 50 level.
Key Support Levels – $0.2700 and $0.2540.
Key Resistance Levels – $0.2850, $0.2950 and $0.3000.


Leave a Reply
You must be logged in to post a comment.