- Stellar lumen price is trading well above the key $0.1500 support zone against the US Dollar.
- XLM price is struggling to clear the $0.1800 resistance and the 55 simple moving average (4-hours).
- There is a crucial bearish trend line forming with resistance near $0.1750 on the 4-hours chart (data feed via Kraken).
- The pair could start a strong increase if there is a clear break above $0.1750 and $0.1800.
Stellar lumen price declined below the $0.2000 support area against the US Dollar, while bitcoin is stable. XLM price is once again preparing for a major break if it clears $0.1800.
Stellar Lumen Price Analysis (XLM to USD)
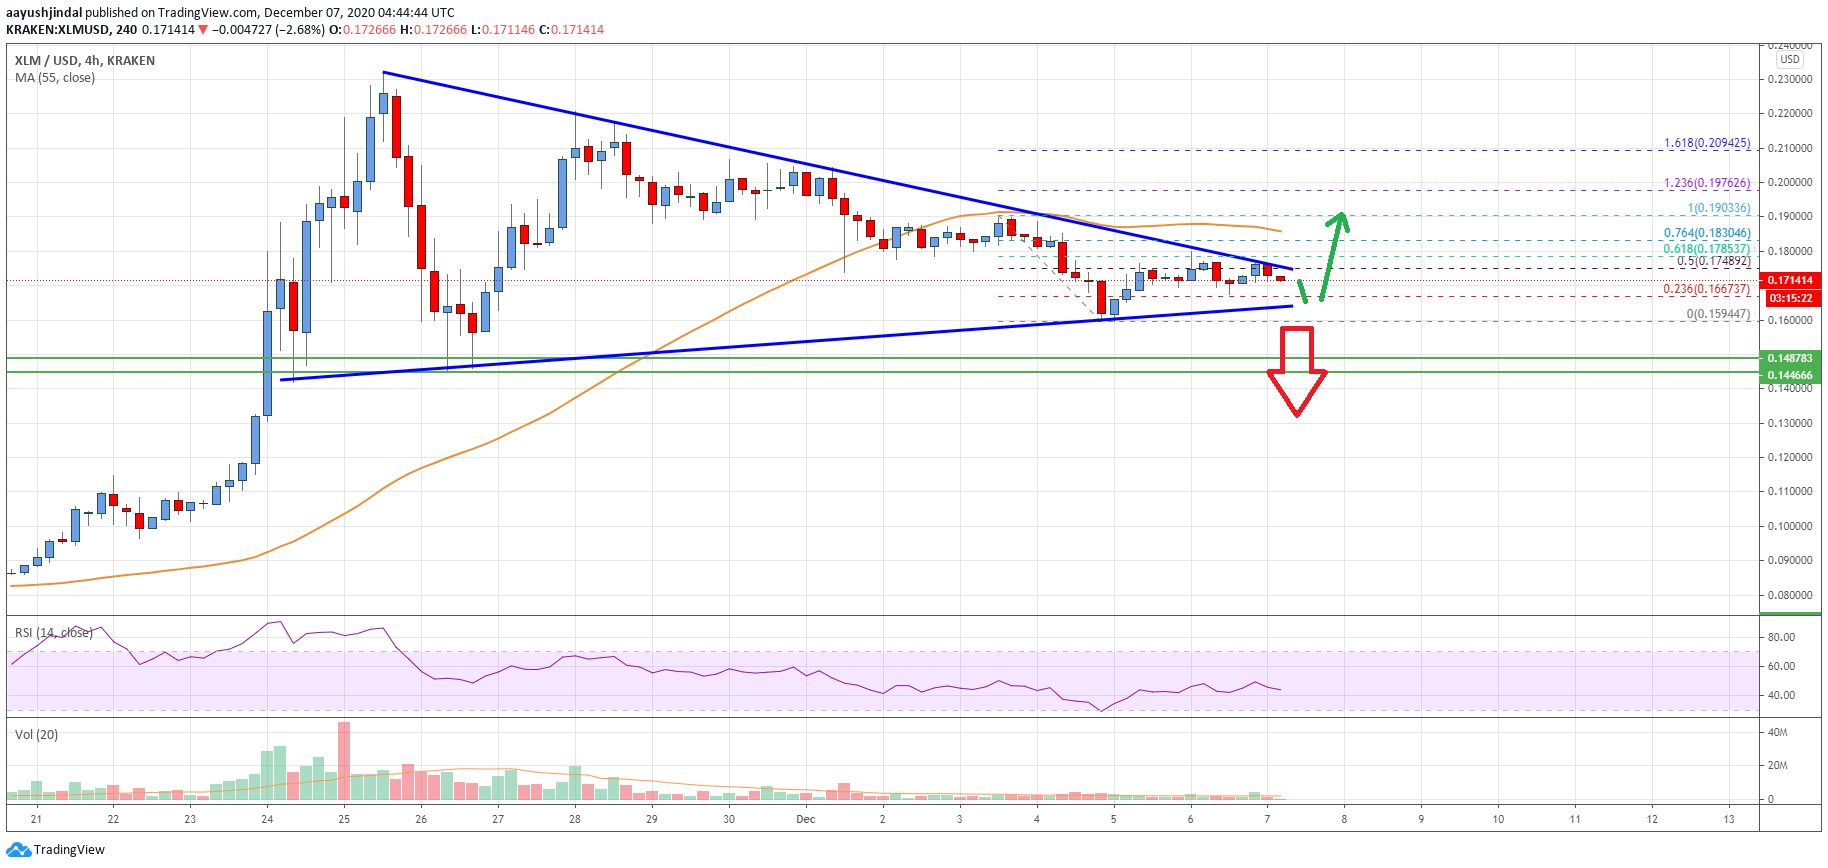
In the past few days, stellar lumen price followed a bearish path from the $0.2200 zone against the US Dollar. The XLM/USD pair broke the $0.2000 support zone and the 55 simple moving average (4-hours) to move into a bearish zone.
It even broke the $0.1800 support, but the bulls remained active above $0.1500 and $0.1550. A low is formed near $0.1594 and the price is recovering higher. There was a break above the $0.1700 level.
The price also climbed above the 50% Fibonacci retracement level of the downward move from the $0.1903 swing high to $0.1594 low. It is now struggling to clear the $0.1800 resistance and the 55 simple moving average (4-hours).
There is also a crucial bearish trend line forming with resistance near $0.1750 on the 4-hours chart (data feed via Kraken). The trend is also close to the 61.8% Fibonacci retracement level of the downward move from the $0.1903 swing high to $0.1594 low.
A clear break above the trend line resistance might increase the chances of a strong upward move above the $0.1800 level. A successful close above the $0.1800 zone could lead the price towards the $0.2000 resistance zone.
Conversely, there is a risk of a downside break below the $0.1600 support zone. The main support is still near $0.1500, below which the price might slide significantly.

The chart indicates that XLM price is clearly facing hurdles near $0.1800 and the 55 simple moving average (4-hours). Overall, the price could start a strong increase if there is a clear break above $0.1750 and $0.1800.
Technical Indicators
4 hours MACD – The MACD for XLM/USD is showing no major positive signs in the bullish zone.
4 hours RSI – The RSI for XLM/USD is now below the 50 level.
Key Support Levels – $0.1600 and $0.1500.
Key Resistance Levels – $0.1750, $0.1800 and $0.2000.


Leave a Reply
You must be logged in to post a comment.