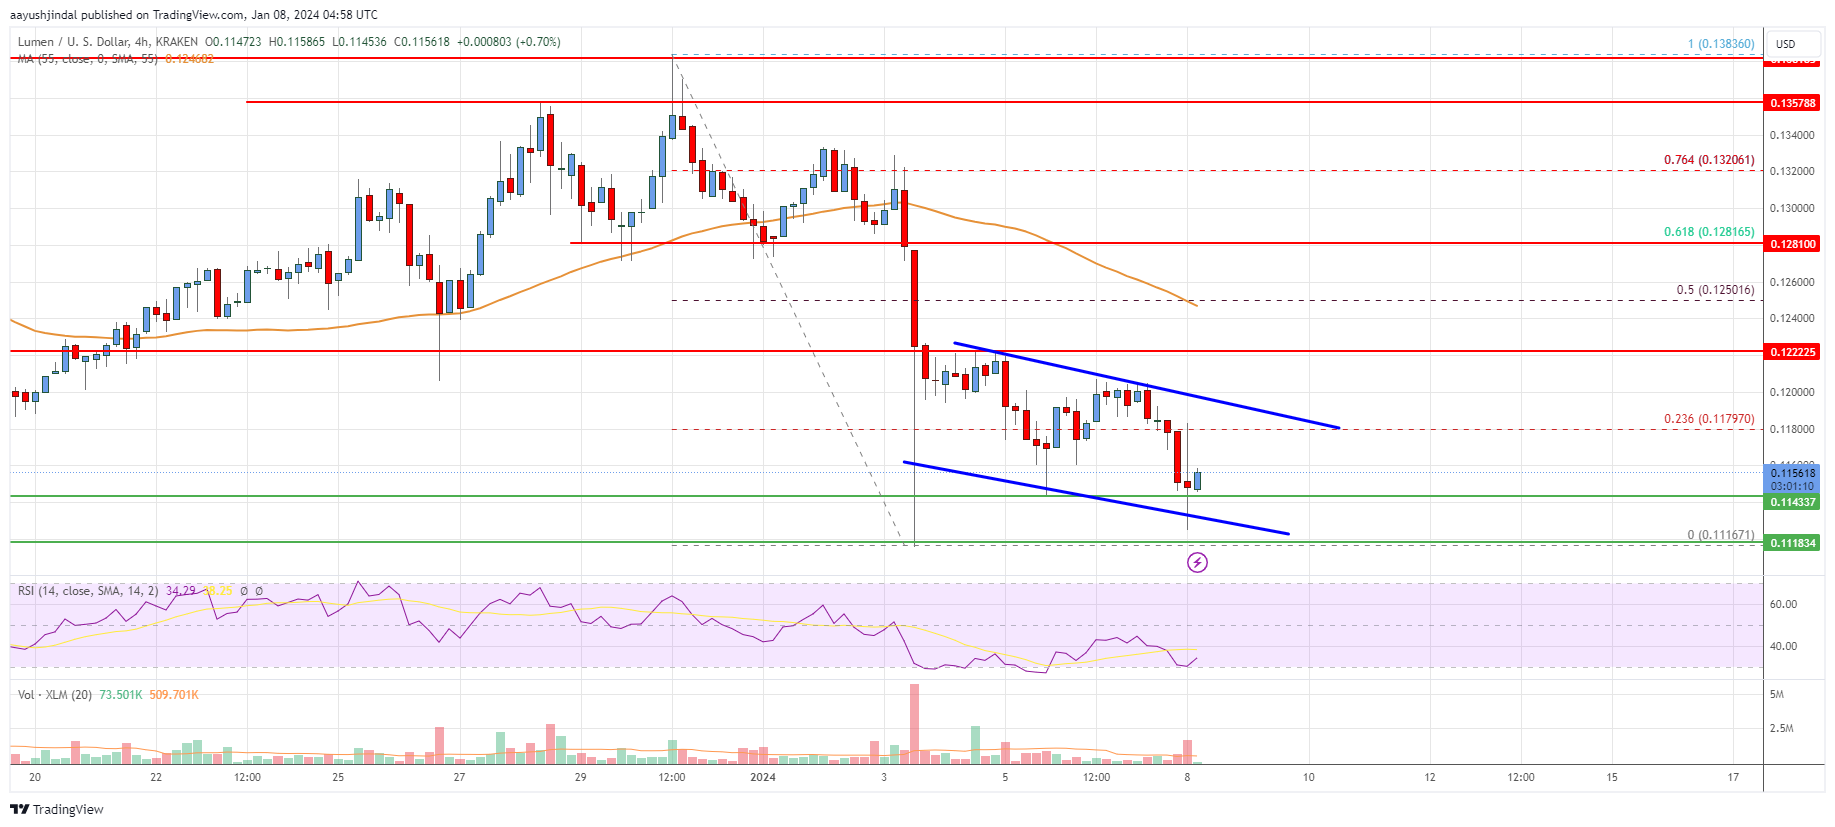
- Stellar lumen price is gaining pace below the $0.120 support zone against the US Dollar.
- XLM price is now trading below $0.120 and the 55 simple moving average (4 hours).
- There is a key declining channel forming with resistance near $0.1180 on the 4-hour chart (data feed via Kraken).
- The pair could extend its decline below the $0.1115 support zone in the near term.
Stellar lumen price is trading below $0.1200 against the US Dollar, like Bitcoin. XLM price could extend losses if it trades below the $0.1115 support.
Stellar Lumen Price Analysis (XLM to USD)
In the past few sessions, Stellar Lumen price struggled to climb above the $0.1220 resistance against the US Dollar. The XLM/USD pair failed to continue higher and started a fresh decline.
There was a move below the $0.1200 and $0.1180 levels. The decline gained pace below the $0.1150 level. A low was formed near $0.1116, and the price is now consolidating losses. There is also a key declining channel forming with resistance near $0.1180 on the 4-hour chart.
XLM is now trading below $0.120 and the 55 simple moving average (4 hours). Immediate resistance is near the $0.1180 level. It is close to the 23.6% Fib retracement level of the downward move from the $0.1383 swing high to the $0.1116 low.
The next key resistance is seen near the $0.1220 level. A clear upside break above the $0.1220 zone might send the price toward $0.1250. Any more gains could lead the price toward the $0.128 level or the 61.8% Fib retracement level of the downward move from the $0.1383 swing high to the $0.1116 low.
If not, the price might continue to move down. Initial support on the downside is near the $0.1142 level. The next major support is $0.1115. Any more losses could lead the price toward the $0.1100 level in the near term, below which the price might even test $0.1050.

The chart indicates that XLM price is now trading below $0.120 and the 55 simple moving average (4 hours). Overall, the price could start a fresh increase if it clears the $0.122 resistance.
Technical Indicators
4 hours MACD – The MACD for XLM/USD is gaining momentum in the bearish zone.
4 hours RSI – The RSI for XLM/USD is now below the 50 level.
Key Support Levels – $0.1142 and $0.1115.
Key Resistance Levels – $0.1180, $0.1220, and $0.1280.