
Bitcoin spot trading is flashing bullish signals, with $113,650 as the next most important level to break for a possible $119K rally.
Bitcoin’s spot trading has picked up and is now showing a possible breakout toward $119,000. On-chain metrics and exchange flows indicate that market activity is on the rise, and buyers are showing conviction at current levels.
Why $113,650 Matters for Bitcoin Spot Trading
Glassnode data currently shows a sharp divergence between Bitcoin and Ethereum. Particularly, Bitcoin’s Cost Basis Distribution (CBD) shows heavy clustering. This means that investors are accumulating more strongly.
Cost Basis Distribution (CBD) shows a clear divergence in spot flows between #Bitcoin and #Ethereum: $BTC spot activity is dense, while $ETH remains sparse with air gaps. This suggests ETH price dynamics may be more influenced by off-chain markets such as derivatives. pic.twitter.com/tV8VfM8HKA
— glassnode (@glassnode) September 2, 2025
Comparatively, Ethereum’s flows are showing lower levels of clustering. This dense trading activity in Bitcoin spot markets can be a sign that support is durable, compared to the momentum driven by the derivatives.
So far, the market has reacted to this with optimism. Bitcoin recently rebounded from $107,300 to over $111,000. Traders are now watching the $113,650 level as the most important resistance point.
All of this being said, for Bitcoin spot trading momentum to translate into a sustained rally, the $113,650 resistance must break.
Analysts note that this level has capped price action over the past two weeks. Put simply, a daily close above it would confirm a bullish structure and open the path toward liquidity targets at $116,300, $117,500 (and even $119,500).
So far, short-term indicators are also in support of this bullish case. The four-hour chart shows a positive change, and the relative strength index recently reclaimed levels above 50.
Lower time frames also indicate fresh momentum after a two-week corrective phase.
Exchange Flows Show Shifting Liquidity
Exchange netflows further reinforce this bullish outlook. CryptoQuant data shows that Coinbase recorded consistent inflow spikes between August 25 and August 31.
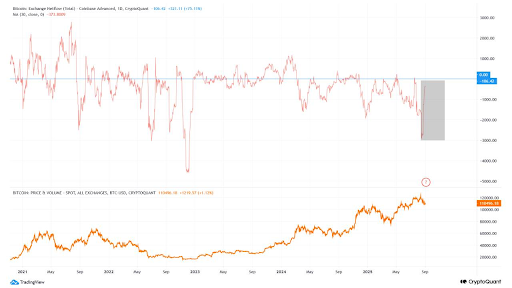
This came just after Bitcoin’s 30-day simple moving average fell to the lowest level since early 2023. The trend is even more interesting, considering Biance shows the same thing.
Long-Term Holders Show Controlled Distribution
Long-term holder (LTH) activity has also blown up over the last few weeks. The 14-day SMA of LTH spending indicates some profit-taking. However, levels remain below cycle peaks seen late last year.
This indicates that distribution is more measured, rather than investors engaging in heavy selling. Long-term investors appear confident enough to keep most of their holdings, which has done much to reduce the downside pressure on the market.
Despite the positive signals, Bitcoin still faces a seasonal hurdle. September is historically the weakest month for cryptocurrency, and is often called “red September.”
Over the past 12 years, average returns have been negative and have been weighed down by major regulatory shocks and caution in investor sentiment.
September is also the weakest month for the S&P 500, as funds rebalance heading into the final quarter.
Why 2025 May Break the Pattern
This year, conditions look more supportive than in past cycles. Spot Bitcoin ETFs, which were approved early last year, continue to post billions of dollars in daily trading volumes.
Macroeconomic policy also supports the bullish case. The Federal Reserve has already delivered rate cuts in 2024 and is expected to lower rates again in mid-September.
In all, Bitcoin spot trading still shows encouraging signs of recovery. This means that a decisive break above $113,650 would validate the bullish trend and set the stage for higher targets up to $119,500.

