- Tron price remained stable above the $0.0420 support zone against the US Dollar.
- TRX price is now testing the $0.0480 resistance and the 55 simple moving average (4-hours).
- There is a key bearish trend line forming with resistance near $0.0480 on the 4-hours chart (data feed via Bitfinex).
- The pair could start a fresh rally if it clears the $0.0480 and $0.0500 resistance levels in the near term.
TRON price is showing positive signs above $0.0420 against the US Dollar, similar to bitcoin. TRX price must settle above $0.0500 to start a strong increase in the near term.
Tron Price Analysis
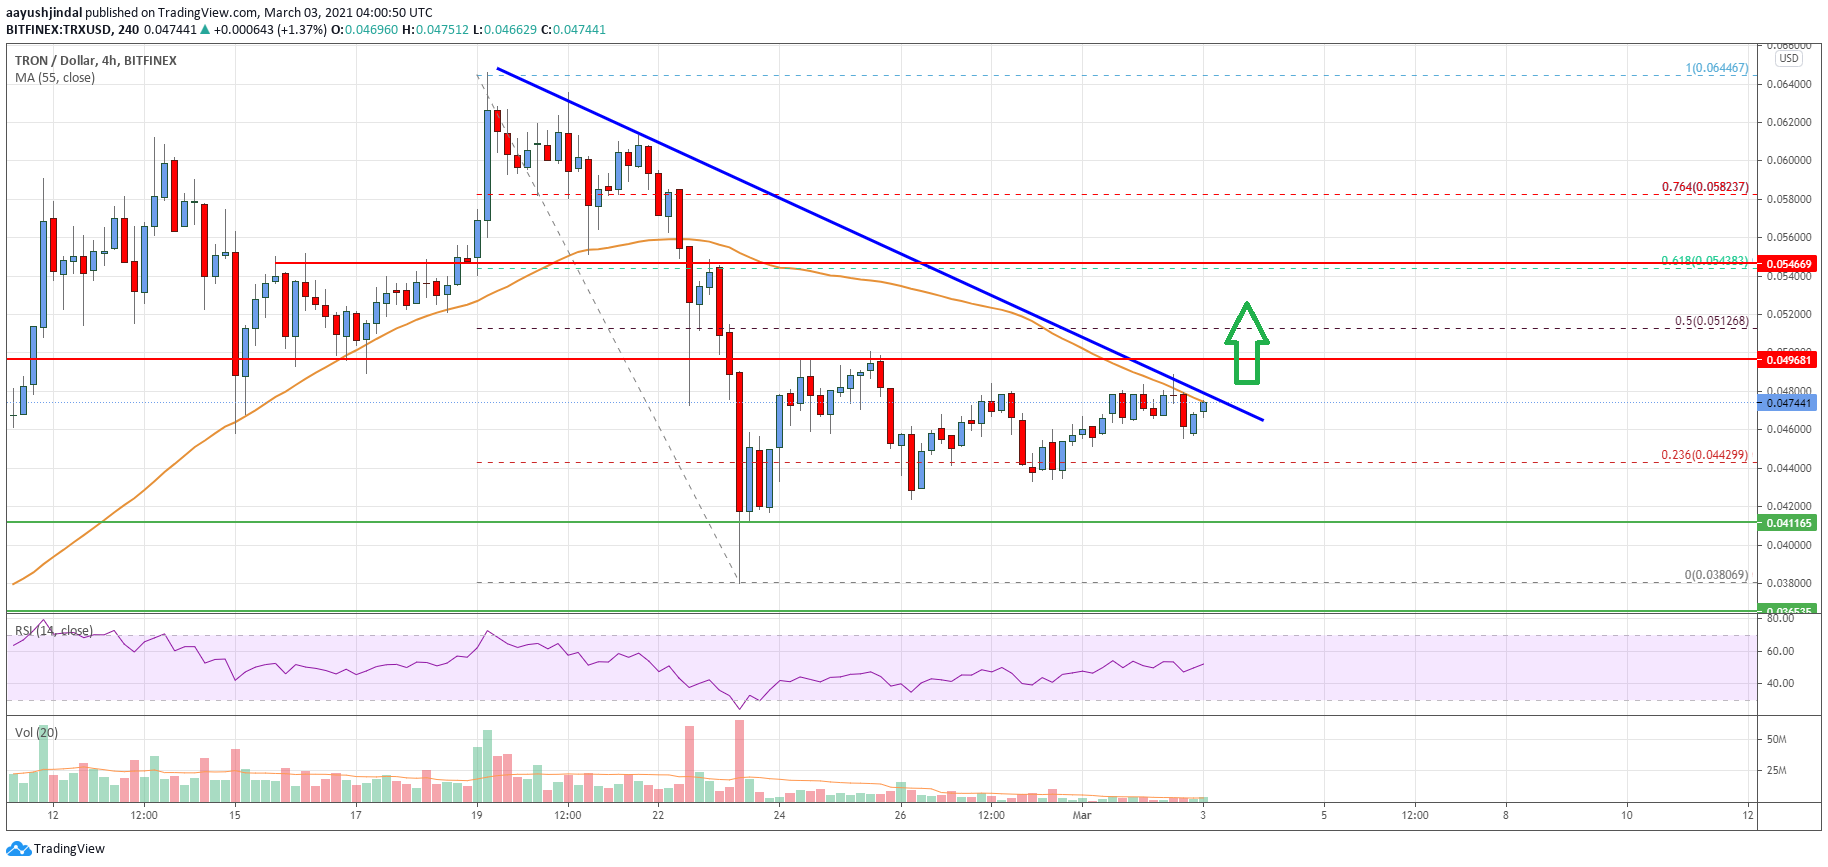
After a sharp decline, tron price found support near the $0.0380 level against the US Dollar. TRX price formed a support base above $0.0400 and recently started a decent recovery wave.
There was a break above the $0.0420 and $0.0425 resistance levels. The price recovered above the 23.6% Fib retracement level of the downward move from the $0.0644 high to $0.0380 low. It is now testing the $0.0480 resistance and the 55 simple moving average (4-hours).
There is also a key bearish trend line forming with resistance near $0.0480 on the 4-hours chart. The next major resistance above the trend line is near the $0.0500 level. The 50% Fib retracement level of the downward move from the $0.0644 high to $0.0380 low is also near the $0.0510 level.
Therefore, a clear break above the $0.0500 and $0.0510 resistance levels could start a strong increase. The next major resistance is near $0.0550, above which the price could rally towards $0.0600.
Conversely, the price might struggle to clear the trend line and $0.0500. An initial support on the downside is near the $0.0450 level. The next major support is near the $0.0420 level, below which there is a risk of a drop towards the $0.0380 low. Any more losses might call for a test of the $0.0350 level.

The chart indicates that TRX price is clearly testing a major hurdle near $0.0480 and $0.0500. Overall, the price could start a fresh rally if it clears the $0.0480 and $0.0500 resistance levels in the near term.
Technical Indicators
4 hours MACD – The MACD for TRX/USD is slowly gaining momentum in the bullish zone.
4 hours RSI – The RSI for TRX/USD is just above the 50 level.
Key Support Levels – $0.0450 and $0.0420.
Key Resistance Levels – $0.0480, $0.0500 and $0.0550.


Leave a Reply
You must be logged in to post a comment.