- Tron price jumped above $0.0200 and traded to a new 2020 high at $0.0237 against the US Dollar.
- TRX price is currently correcting lower and trading nicely above the $0.0205 support area.
- There is a major contracting triangle forming with resistance near $0.0220 on the 4-hours chart (data feed via Bitfinex).
- The bulls are likely to aim a fresh upside break above the $0.0220 and $0.0230 resistance levels.
TRON price is trading in a strong uptrend against the US Dollar, similar to bitcoin. TRX price is likely to climb again as long as it is above the $0.0200 support area.
Tron Price Analysis
In the past few days, there was a strong upward move in TRON price above the $0.0180 resistance level against the US Dollar. TRX price even climbed above the $0.0200 resistance and the 55 simple moving average (4-hours).
The bulls gained strength and the price climbed above the $0.0220 level. A new yearly high is formed near $0.0237 and the price is currently correcting lower.
There was a break below the $0.0220 level, but the bulls defended the $0.0205 support area. A swing low is formed near $0.0203 and the price is currently rising. It broke the 50% Fibonacci retracement level of the recent correction from the $0.0237 high to $0.0203 low.
However, the price seems to be facing a strong resistance near the $0.0225. Besides, the 61.8% Fibonacci retracement level of the recent correction from the $0.0237 high to $0.0203 low is acting as a hurdle.
At the outset, there is a major contracting triangle forming with resistance near $0.0220 on the 4-hours chart. If there is an upside break above the $0.0220 and $0.0225 resistance levels, the price is likely to resume its upward move.
The next resistance is seen near the $0.0235 level. A clear break above the $0.0235 level might set the pace for a run towards the $0.0250 and $0.0265 levels.
If there is a downside break below the triangle support, the price could revisit the $0.0205 support level. Any further losses may perhaps lead the price towards the $0.0200 support level.
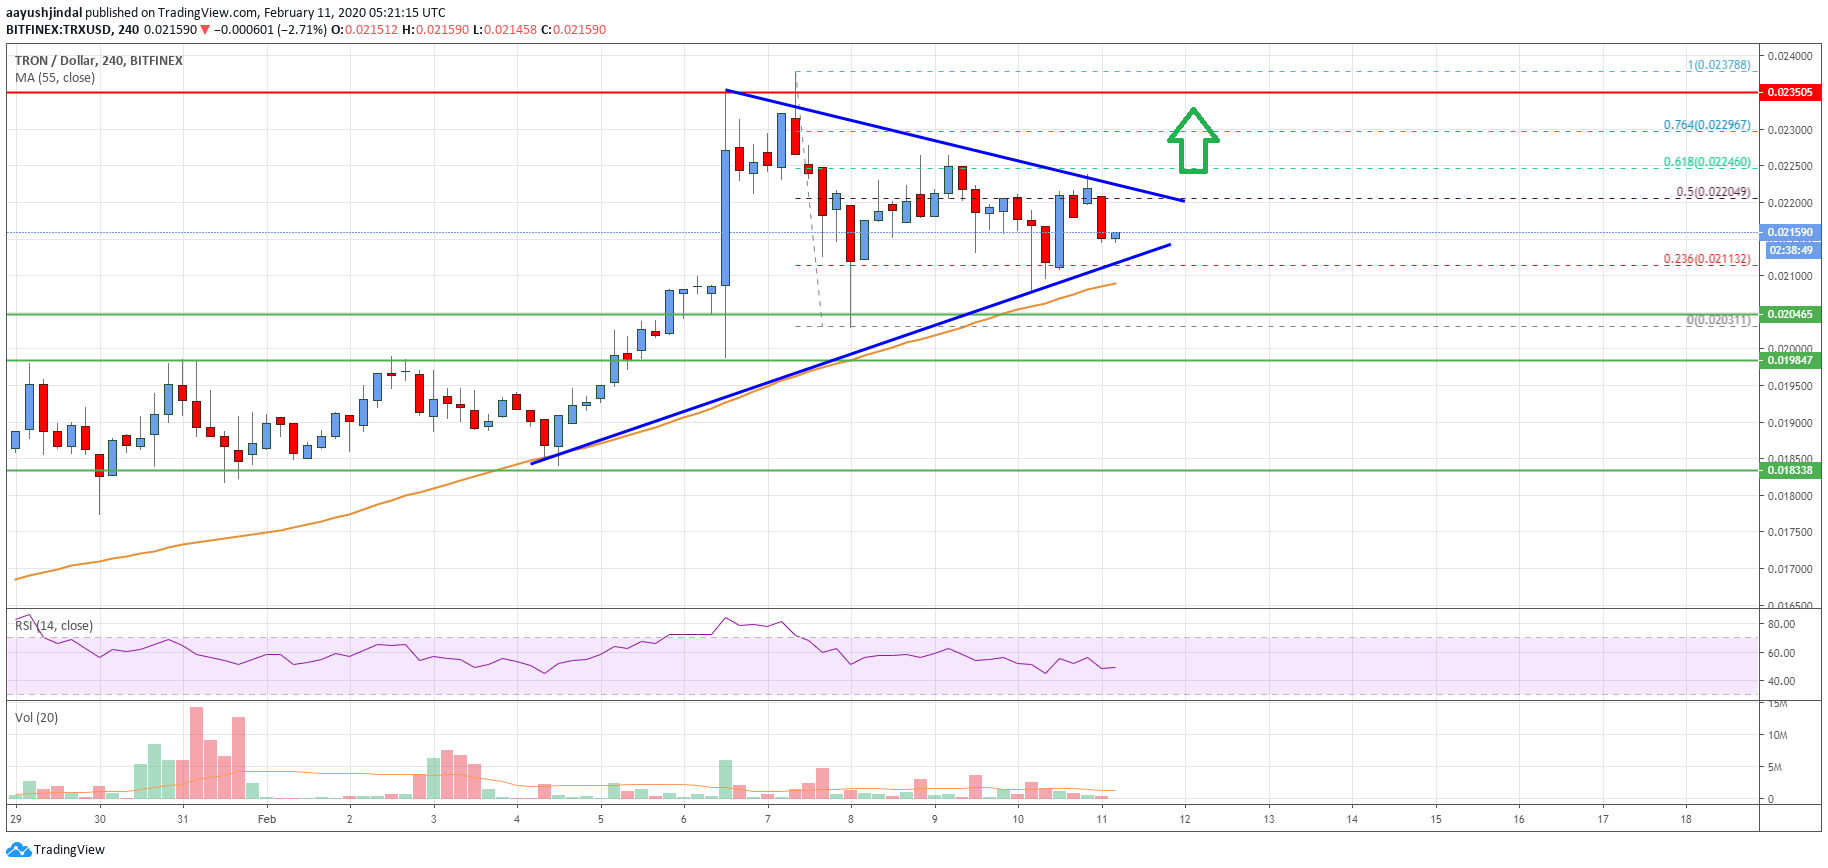
The chart indicates that TRX price is clearly trading above a couple of important support above the $0.0205 and $0.0200 levels. A clear break above the $0.0225 might open the doors for a larger upward move in the coming sessions.
Technical Indicators
4 hours MACD – The MACD for TRX/USD is slowly gaining momentum in the bullish zone.
4 hours RSI – The RSI for TRX/USD is currently just above the 50 level.
Key Support Levels – $0.0205 and $0.0200.
Key Resistance Levels – $0.0225, $0.0230 and $0.0250.


Leave a Reply
You must be logged in to post a comment.