
- Tron price is trading in a bullish zone above the $0.0150 support against the US Dollar.
- TRX price is currently facing a strong resistance near the $0.0165 and $0.0166 resistance levels.
- There is a major bullish trend line forming with support near $0.0156 on the 4-hours chart (data feed via Bitfinex).
- The price could correct a few points, but it is likely to remain well bid above $0.0155.
TRON price is trading in an uptrend above $0.0150 against the US Dollar, similar to bitcoin. TRX price could continue to rise towards the $0.0180 and $0.0200 resistance levels.
Tron Price Analysis
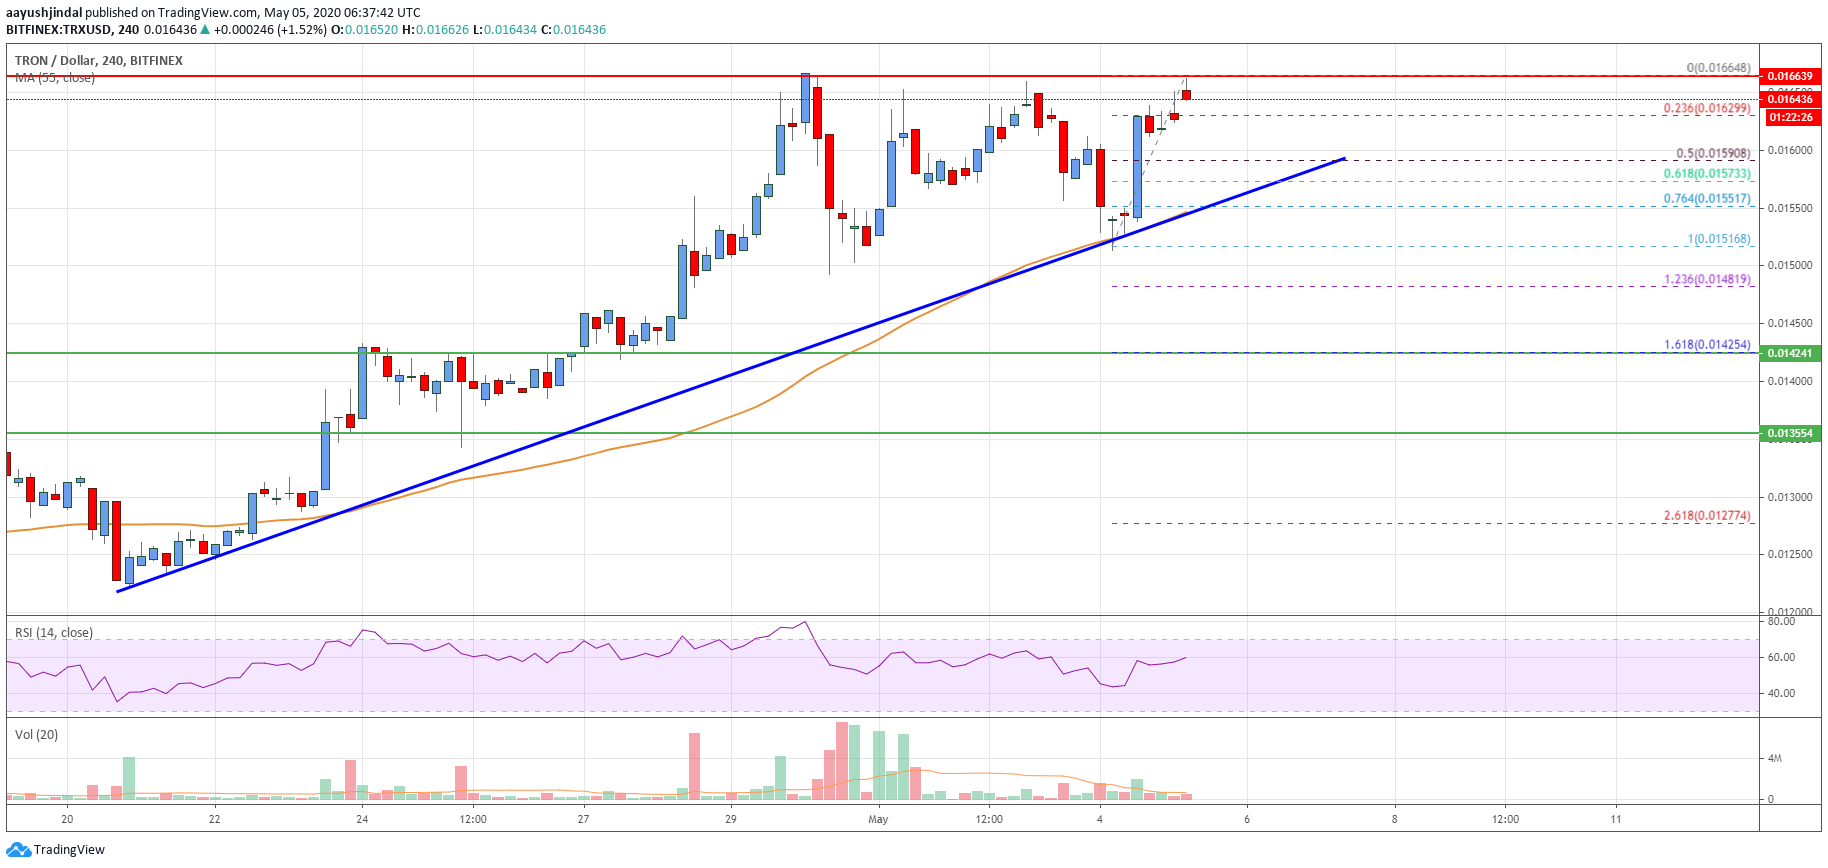
In the past few days, TRON price remained in an uptrend above the $0.0150 pivot level against the US Dollar. TRX price broke many hurdles near $0.0155 and $0.0158 to move further into a positive zone.
The bulls even pushed the price above the $0.0162 resistance and the 55 simple moving average (4-hours). The price traded to a new multi-week high at $0.0166 and it is currently consolidating gains.
It seems like the price is facing a strong resistance near the $0.0165 and $0.0166 resistance levels. An initial support on the downside is near the $0.0159. It is close to the 50% Fibonacci retracement level of the recent surge from the $0.0151 low to $0.0166 high.
There is also a major bullish trend line forming with support near $0.0156 on the 4-hours chart. The trend line coincides with the 61.8% Fibonacci retracement level of the recent surge from the $0.0151 low to $0.0166 high.
If there is a downside break below the trend line support, there is a risk of a correction extension towards the $0.0152 and $0.0150 levels. If there are more losses below $0.0150, the bears are likely to push tron price towards the main $0.0142 support zone.
On the upside, the price must surpass the $0.0165 and $0.0166 resistance levels to set the stage for more upsides. The next key resistance is near the $0.0180 level, above which the bulls are likely to aim a test of the $0.0200 level in the near term.
The chart indicates that TRX price is clearly trading in a positive zone above the $0.0155 level. Therefore, there are chances of another rally if there is a clear break above the $0.0166 resistance zone.
Technical Indicators
4 hours MACD – The MACD for TRX/USD is currently losing momentum in the bullish zone.
4 hours RSI – The RSI for TRX/USD is currently well above the 50 level.
Key Support Levels – $0.0158 and $0.0155.
Key Resistance Levels – $0.0165, $0.0166 and $0.0180.


Leave a Reply
You must be logged in to post a comment.