- Tron price started a downside correction from the $0.0650 level against the US Dollar.
- TRX price is now trading above $0.0500 and near the 55 simple moving average (4-hours).
- There is a key bullish trend line forming with support near $0.0535 on the 4-hours chart (data feed via Kraken).
- The pair could continue to move up if it breaks the $0.055 resistance zone.
TRON price started a fresh increase above $0.050 against the US Dollar, similar bitcoin. TRX price could rise further if it clears the $0.055 resistance.
Tron Price Analysis
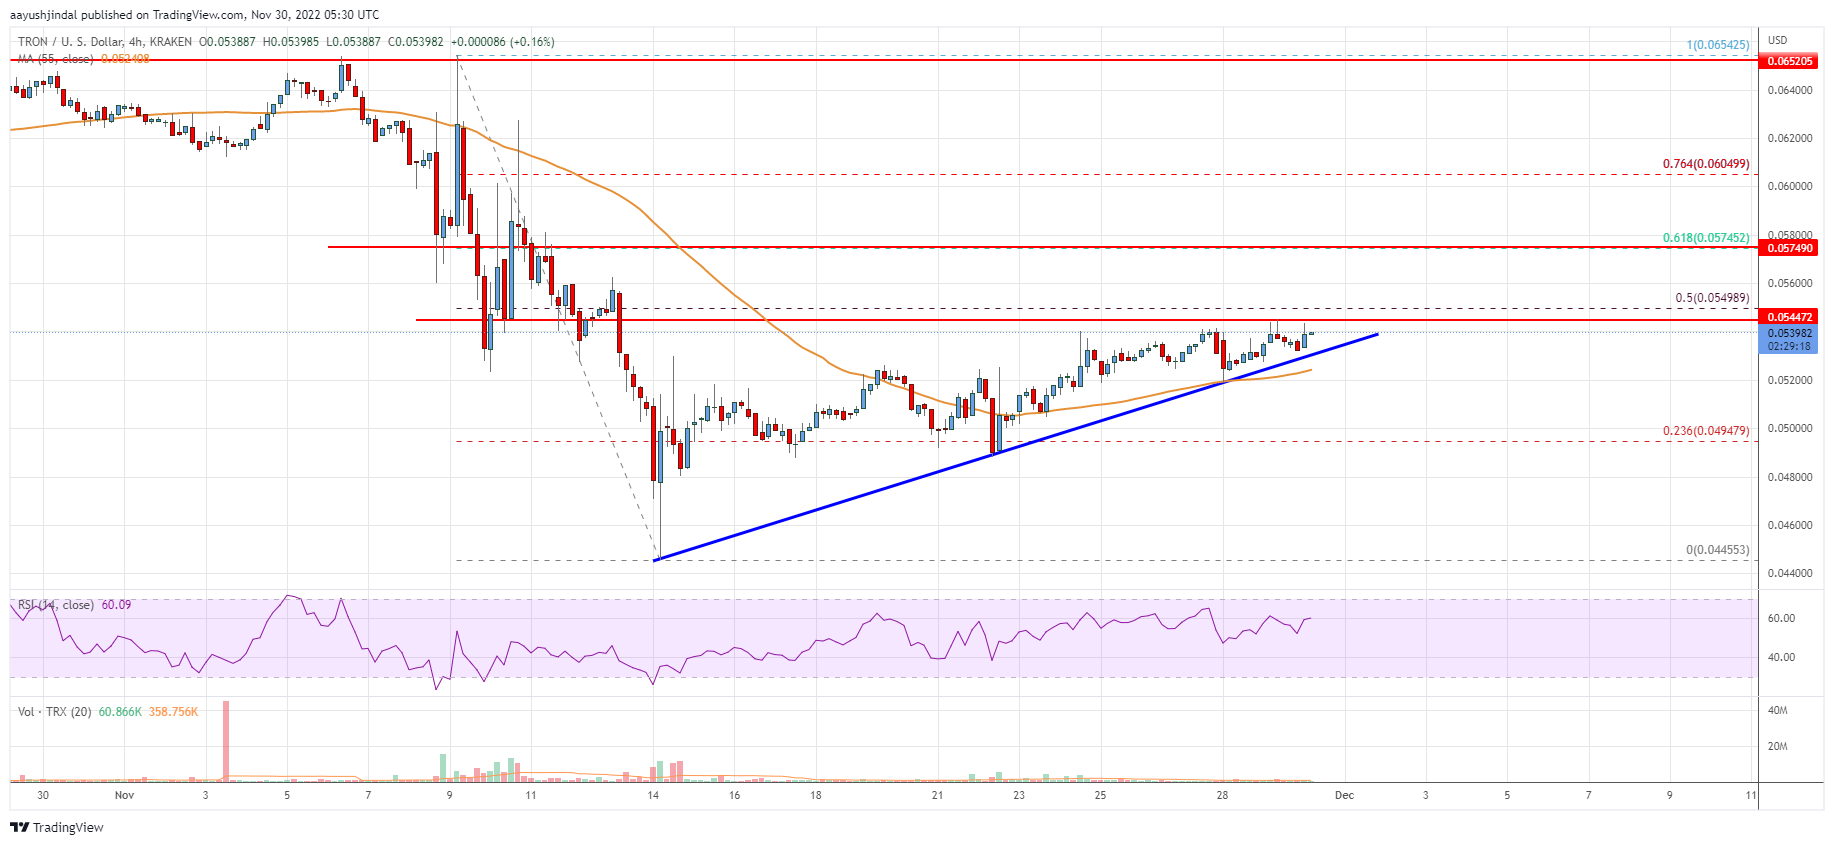
This month, tron price found support near the $0.0445 level against the US Dollar. TRX price formed a base above the $0.0450 level and started a fresh increase.
It traded above the $0.0480 and $0.0500 resistance levels to move into a positive zone. The price pumped above the 23.6% Fib retracement level of the downward move from the $0.0654 swing high to $0.0445 low. It is now trading above $0.0500 and the 55 simple moving average (4-hours).
There is also a key bullish trend line forming with support near $0.0535 on the 4-hours chart. On the upside, TRX is facing resistance near the $0.0550 level. It is near the 50% Fib retracement level of the downward move from the $0.0654 swing high to $0.0445 low.
The first major resistance is near the $0.0575 level. A close above $0.0575 is must for a fresh increase. In the stated case, the price could rise towards the $0.0650 resistance in the near term.
On the downside, an initial support is near the $0.0530 level and the trend line zone. The next major support is now forming near $0.0520 and the 55 simple moving average (4-hours). If there is a downside break below the $0.0520 support, the price might revisit the $0.0500 support. Any more losses might call for a move towards the $0.0445 zone in the near term.

The chart indicates that TRX price is now trading above $0.050 and near the 55 simple moving average (4-hours). Overall, the price could continue to move up if it breaks the $0.055 resistance zone.
Technical Indicators
4 hours MACD – The MACD for TRX/USD is slowly gaining momentum in the bullish zone.
4 hours RSI – The RSI for TRX/USD is above the 50 level.
Key Support Levels – $0.0520 and $0.0500.
Key Resistance Levels – $0.0550, $0.0575 and $0.0650.


Leave a Reply
You must be logged in to post a comment.