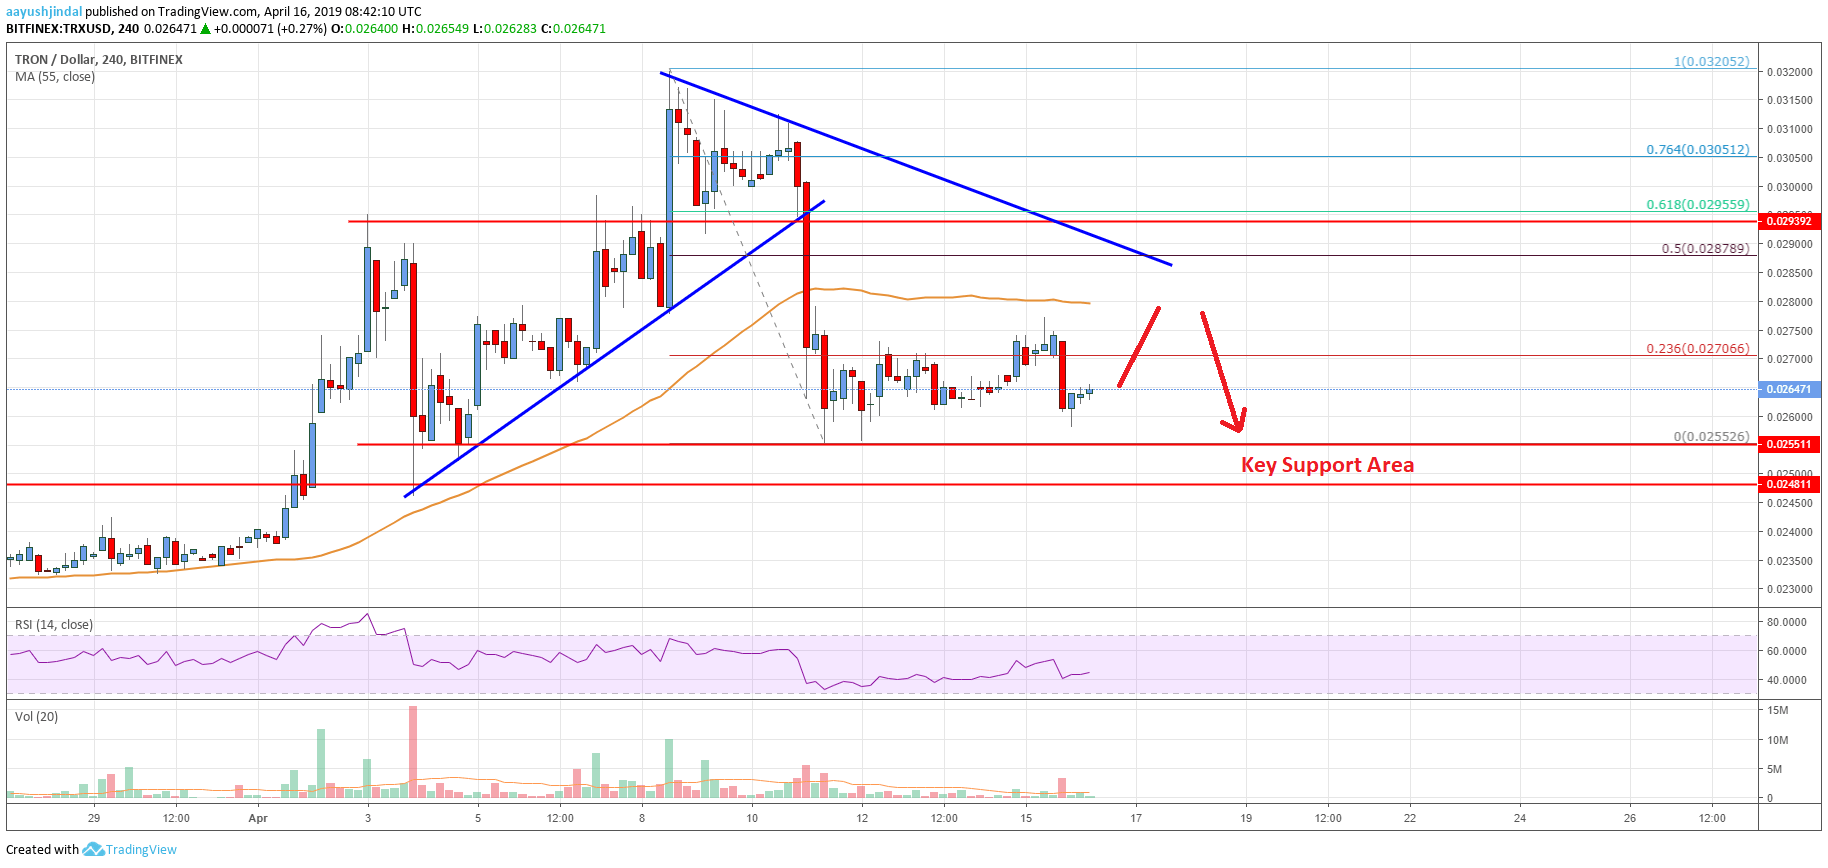
- Tron price corrected lower sharply after setting a top near the $0.0320 level against the US Dollar.
- TRX declined below the $0.0292 support and recently tested the key $0.0255 support area.
- There is a major bearish trend line in place with resistance at $0.0285 on the 4-hours chart (data feed via Bitfinex).
- The price remains well supported on dips near the $0.0255 and $0.0248 support levels.
TRON price declined recently and tested key supports against the US Dollar and bitcoin. TRX could trade in a range for a few sessions before it could recover above $0.0285 and $0.0292.
Tron Price Analysis
This past week, TRON price climbed nicely above the $0.0300 level against the US Dollar. The TRX/USD pair traded close to the $0.0320 level before sellers appeared. A swing high was formed at $0.0320 before the price started a sharp downside correction. The price declined below the $0.0300 and $0.0292 supports to move into a short term bearish zone. Later, there was a break below the $0.0285 support and the 55 simple moving average (4-hours).
It tested the $0.0255 support area, which acted as a strong buy zone. Recently, there was a short term recovery above the $0.0260 level. The price broke the 23.6% Fibonacci retracement level of the last decline from the $0.0320 high to $0.0255 low. However, tron bulls faced a strong resistance near the $0.0275 level. The price trimmed gains and it failed to test the 50% Fibonacci retracement level of the last decline from the $0.0320 high to $0.0255 low.
On the upside, there is a strong resistance formed near $0.0280 and the 55 simple moving average (4-hours). Besides, there is a key bearish trend line in place with resistance at $0.0285 on the 4-hours chart. Therefore, a close above the $0.0280 and $0.0285 resistance levels is must for a fresh increase. The next key resistance is at $0.0305. An intermediate resistance is $0.0295 and the 61.8% Fibonacci retracement level of the last decline from the $0.0320 high to $0.0255 low.

The chart indicates that TRX price is facing an uphill task and many resistances near $0.0280. It seems like the price may trade in a range for a few sessions above $0.0255 before the next move. If there is a downside break below $0.0255, the price may test the next support $0.0248 or $0.0242. On the upside, a break above $0.0285 could set the pace for more gains.
Technical Indicators
4 hours MACD – The MACD for TRX/USD is currently flat in the bearish zone, with negative signs.
4 hours RSI – The RSI for TRX/USD is currently above the 40 level, with a bullish angle.
Key Support Levels – $0.0255 and $0.0248.
Key Resistance Levels – $0.0275, $0.0280 and $0.0285.


Leave a Reply
You must be logged in to post a comment.