
- Veteran trader Peter Brandt says Bitcoin’s “Little Banana” within the “Big Banana” pattern could signal an upcoming BTC breakout.
- BTC trades near $69,803 after rising 3.2% as easing US–Iran tensions improved overall crypto market sentiment.
- Brandt’s long-term chart suggests Bitcoin could reach up to $280K if the parabolic channel pattern continues.
Veteran trader Peter Brandt says a “banana” chart pattern may point to a coming breakout in Bitcoin. The analyst shared the view after Bitcoin showed signs of recovery and traded near $69,800.
His chart shows a short-term curve inside a longer trend channel. According to Brandt, the formation could lead to what he calls a “banana split,” a move that often precedes a strong price rise.
Peter Brandt Points to Banana Pattern on Bitcoin Chart
Peter Brandt recently shared a chart on X showing a pattern he describes as the “Little Banana” forming inside a larger curve. The long-term curve is referred to as the “Big Banana.” According to Brandt, this type of setup often appears before large price moves.
Brandt explained that the smaller curve usually forms during a consolidation phase. The price then moves upward once the structure completes. In his post, Brandt wrote that the formation could lead to a “banana split,” which signals a potential breakout in Bitcoin
The Big Banana is forming a Little Banana — and it indicates there is about to be a Banana Split $BTC🍓🍌🍨🫕 pic.twitter.com/0bDCPU3tGP
— Peter Brandt (@PeterLBrandt) March 10, 2026
The chart also compares earlier Bitcoin cycles that followed similar curved channels. These patterns appear on longer time frames and can last for months. Brandt said such structures often repeat in the market over time.
Short Term Formation Inside Long Term Trend
Brandt’s analysis shows Bitcoin still trading within a long-term parabolic channel. This broader curve represents the “Big Banana.” The structure has guided Bitcoin through several market cycles in past years.
Inside this channel, the “Little Banana” forms as a shorter curve during a pause in price movement. When the smaller curve completes, the price may accelerate within the larger trend. Brandt noted that this pattern has appeared roughly every 52 weeks in earlier cycles.
The chart suggests that the current market may be approaching the stage where the pattern breaks upward. If the curve fails, the price may move lower before another attempt. However, the structure remains intact at present.
Market Conditions Offer Support to Bitcoin
Bitcoin has faced pressure in recent weeks due to global uncertainty. Tensions between the United States and Iran affected financial markets and pushed oil prices higher earlier.
The situation eased after reports of efforts to reduce the conflict. Oil prices later declined, and crypto markets responded with modest gains. Bitcoin moved above $69,000 as traders reacted to the changing conditions.
Market sentiment also shifted after comments from U.S. President Donald Trump about plans to end the conflict soon. These developments helped stabilize risk assets and supported Bitcoin’s short-term recovery.
Bulls Watch $74,116 Resistance Level
Bitcoin’s lower timeframe chart remained bullish during the recent rally. The cryptocurrency traded above $71,000 after buyers defended the $65,700 support level . That move helped BTC gain nearly 5%.
Traders are now watching the $74,116 resistance level. If Bitcoin closes its daily candle above that mark, the next upside target could be $79,297. That would be the first move to that level since February 2.
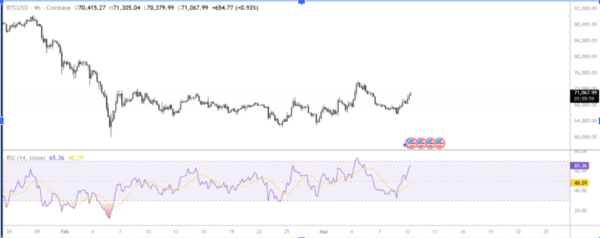
Momentum indicators also supported the current price trend. The MACD lines stayed in positive territory, which showed growing bullish momentum. The RSI near 64 also suggested that buyers remained in control.
Still, the upside move needs confirmation. If Bitcoin fails to close above $74,000, sellers could return. In that case, the market may move back toward the $65,000 support area.

