
XRP trades near $1.30 in a Wave 2 pullback, with $1.28 support and $1.38 resistance as traders watch the next move.
XRP is trading near $1.30 after a steep pullback from its 2025 high. The decline followed a rally that lifted price nearly six times from the $0.60 area.
Analysts are now tracking whether the move fits a larger Wave 2 retracement. At the same time, traders are watching support, resistance, and momentum readings for direction.
Analyst Tracks Wave 2 Retracement Zones
One market analyst said XRP completed five intermediate waves into its July 2025 high.
That move began from the July 2024 lows and formed Primary Wave 1. The analyst now places XRP in a Primary Wave 2 retracement.
The analyst described the decline as a “healthy pullback” after five waves higher.
According to that view, the 0.5 Fibonacci level near $1.21 has already been tested. That level now sits as the first completed retracement marker.
#XRP update…$XRP pumped nearly 6x since our 0.60$ area teat to its long term lower trendline and following retracement after completing 5 intermediate waves to upside…
so here’s the update…
after completing 5 intermediate 𝐖𝐀𝐕𝐄𝐒 for completing primary 𝐖𝐀𝐕𝐄 1 from… https://t.co/UAmQvM7u8q pic.twitter.com/rKIbzlFsqM
— CG TRADES (@CG_trades_) April 5, 2026
The next area of interest sits between $0.92 and $0.86. That range matches the 0.618 to 0.65 Fibonacci zone, often called the golden pocket.
The analyst said a monthly close below $0.86 would be a personal invalidation level.
Chart Structure Still Looks Weak in the Medium Term
Separate chart analysis shows XRP remains in a medium-term downtrend. Price has formed lower highs and lower lows since the late 2025 peak.
That peak formed near the $2.40 to $2.50 area on the daily chart. In early February, a sharp selloff broke the prior structure.
After that move, XRP entered a lower trading range and lost upside momentum. Since then, price has moved sideways near the lower end of that range.
The chart suggests a possible base around $1.28 to $1.32. Even so, buyers have not yet produced a strong follow-through move.
That leaves the market vulnerable to another test of lower support. Recent rebounds have also stalled between $1.45 and $1.55.
That pattern shows sellers remain active when price rises into resistance. A move back above $1.40 would improve the near-term picture.
Read Also:
Momentum and Targets Keep Traders Focused on Key Levels
The daily RSI is near 41.6 and remains below the 50 midpoint. That reading points to weak momentum, but it does not show deep oversold conditions.
As a result, the chart does not yet confirm a strong reversal. The MACD also remains below zero, and both lines stay in negative territory.
However, the histogram has flattened compared with earlier red bars. That suggests selling pressure has cooled, but not fully reversed.
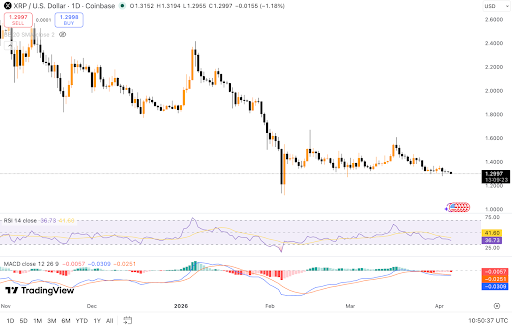
Support remains clustered near $1.28 to $1.30 on the daily chart. Below that area, the February washout near $1.20 is the next key level. A break under $1.20 would strengthen the bearish case.
On the upside, the first resistance sits near $1.38 to $1.40. The stronger resistance zone remains between $1.45 and $1.55. Above that, $1.80 would matter for a broader trend shift.
The wave analysis also includes much higher targets if XRP turns higher. The minimum target cited was $7.58 from current levels.
That estimate rises to $9 if price first reaches the $0.92 to $0.86 zone. The same analysis listed larger upside scenarios after a deeper retracement.
It projected $24.75 if XRP reverses from current levels. It also projected $37 if price reaches the golden pocket before recovering.
