XRP Whales Sent $112.4M to Binance, but the Selling May Already Be Fading

Latest in XRP Price
XRP Whales Sent $112.4M to Binance, but the Selling May Already Be Fading
XRP Price Prediction: $1.30 Holds as Exchange Reserves Hit 11.81B
XRP Price Faces Major Crash Risk as Double Top Signals Possible Fall to $0.80
XRP Whale Accumulation Hits $2.2 Billion as Price Eyes These Next Targets
Oil Risk Premium Spikes Amid Fragile US-Iran Relations
“XRP price today” and “XRP price prediction” are two prominent searches among aspiring investors, new crypto traders, and experienced market participants.
The answers often mix useful data with hype. Phrases such as “XRP to the moon,” “HODL,” or claims of four-figure prices can spread faster than the evidence supporting them.
A better approach starts with the mechanics behind XRP price analysis. Instead of asking only how high XRP could go, investors can examine demand, liquidity, market capitalization, legal developments, ETF flows, and market positioning.
This article explains those drivers and shows how to assess an XRP price prediction without treating it as a guarantee. It also covers XRP’s market history, technical analysis, whale activity, ETF flows, and extreme-target math.
The goal is not to predict one fixed price. It is to give readers a repeatable framework for understanding XRP price today and evaluating an XRP forecast as market conditions change.
XRP price is influenced by several overlapping forces, including broader crypto-market conditions, ETF demand, liquidity, whale activity, and regulatory developments.
Bitcoin often establishes the broader risk regime for large-cap altcoins. ETF demand can provide another source of spot exposure, while whale transfers and derivatives positioning can amplify short-term moves.
Legal developments also shaped XRP markets for years. However, the Ripple-SEC litigation was concluded in August 2025 after both sides dismissed their appeals, leaving the district court’s judgment and $125 million civil penalty intact. (SEC).
The legal case therefore remains important historical context, but new XRP price analysis should distinguish old lawsuit headlines from genuinely new regulatory developments.
U.S. spot XRP ETFs have created a new flow indicator for XRP markets. The Bitwise XRP ETF began trading on November 20, 2025, providing investors with spot XRP exposure through the NYSE.
ETF flows can now be compared directly with XRP price action. A positive flow day combined with rising XRP can indicate that fund demand is supporting the spot market.
However, positive flows do not guarantee a price increase. XRP can decline when ETF buying is outweighed by selling from other market participants.
Recent reporting showed that XRP traded near $1.08 in late July 2026 while ETF assets and net flows remained below earlier expectations.
The key question is whether ETF demand is large enough to overcome selling elsewhere.
The SEC filed its complaint against Ripple on December 22, 2020. The regulator alleged that Ripple and two executives had conducted an unregistered securities offering involving XRP.
The case became one of the most important XRP price narratives because exchanges, institutions, and traders had to assess its potential market consequences.
A major turning point came in July 2023, when Judge Analisa Torres distinguished between certain institutional XRP sales and programmatic secondary-market transactions.
The ruling did not mean that every XRP transaction was automatically outside securities laws. Instead, the court considered the circumstances surrounding different types of sales.
The litigation eventually ended in August 2025. The SEC and Ripple dismissed their appeals, leaving the district court’s rulings intact. (SEC litigation release).
Future XRP price analysis should therefore treat the lawsuit as an important historical driver while monitoring new regulatory developments separately.
Large XRP transfers can provide useful information about potential changes in market liquidity. However, a whale transfer alone does not prove that a sale is about to happen.
Exchange-bound transfers deserve closer attention because coins moved to trading venues can become immediately available for sale. Even then, analysts must determine whether a transaction represents an external wallet deposit or an internal exchange movement.
Funding rates and open interest provide another layer of information. Crowded long positions can increase liquidation risk, while heavily negative funding can create conditions for a short squeeze.
Realized-profit spikes can also reveal whether holders are taking gains after a rebound. These metrics should be treated as flow and positioning color rather than standalone trading signals.
Understanding XRP price history requires starting with XRP itself rather than beginning with the SEC lawsuit.
The XRP Ledger launched in 2012, while XRP began appearing in tracked market data during 2013. That early market record created the historical price series used by traders and analysts today.
CoinMarketCap’s historical records show XRP being tracked by August 8, 2013, when XRP traded at approximately $0.004254. Its recorded market capitalization was about $33.26 million at the time.
A later August 13 snapshot showed XRP at approximately $0.004245.
These records provide useful early reference points. However, they should not be presented as proof of one exact first trade timestamp because early crypto-market data varied between exchanges and archives.
XRP became one of the most closely followed large-cap crypto assets during subsequent market cycles.
Its price appreciation and large token supply made XRP particularly attractive to retail traders comparing potential unit prices. That helped create the prediction culture surrounding XRP long before the SEC case.
XRP later became one of the largest crypto assets by market capitalization. Its precise ranking changes over time, so current articles should verify the latest ranking rather than assigning it a permanent position.
The SEC filed its complaint against Ripple on December 22, 2020. The regulator alleged that XRP sales beginning in 2013 formed an ongoing unregistered securities offering. (SEC press release).
The lawsuit became a major overhang for XRP because exchanges, institutions, and traders had to consider the potential consequences.
Some U.S. platforms suspended or restricted XRP trading during the litigation. This created a direct connection between legal developments and market access.
The case later progressed through summary judgment, appeals, and further proceedings before the appeals were dismissed in August 2025.
The July 13, 2023 court ruling became a major turning point for XRP markets.
Judge Torres distinguished certain institutional sales from programmatic secondary-market transactions. The distinction helped reopen debates about XRP exchange listings and secondary-market access.
The precise holding matters. It is inaccurate to reduce the decision to a blanket statement that “XRP is not a security.”
The Ripple-SEC case record provides the legal context for the different categories of XRP transactions.
Spot XRP ETFs introduced another measurable source of market demand.
The Bitwise XRP ETF began trading on November 20, 2025. The fund holds spot XRP and provides investors with direct exposure through an exchange-traded structure.
SEC filings also describe the fund’s structure and its use of the CME CF XRP-Dollar Reference Rate.
The ETF era changed the information available to XRP analysts. Instead of relying only on exchange volumes, traders can monitor fund flows and assets.
ETF flow data remains a dated indicator. A strong inflow on one day does not establish a permanent trend.
Whale transfers, realized-profit spikes, and viral XRP predictions recur across market cycles.
A large transfer can attract attention because traders associate exchange deposits with possible selling. Yet wallet labels and transaction history must be checked before drawing conclusions.
The same applies to extreme price targets. A social-media post claiming that XRP will reach $1,000 is not evidence that demand can support the required valuation.
Community narratives such as “to the moon,” HODL, and oversized XRP bags can influence sentiment. They should not replace supply, liquidity, and market-cap analysis.
A useful XRP price today checklist should begin with the current XRP/USD quote. The number alone is not enough.
First, check Bitcoin beta. XRP can move independently for short periods, but broad crypto risk appetite often influences large-cap altcoins.
Second, check ETF flows. Compare daily and weekly flows with XRP price performance rather than treating one positive session as proof of institutional accumulation.
Third, check Ripple news and legal developments. A genuine regulatory or corporate development can alter sentiment, but old headlines should not be recycled as fresh catalysts.
Fourth, check whale exchange transfers. Look for confirmed external deposits rather than assuming every large blockchain movement represents selling.
Fifth, check funding and leverage. Rising open interest alongside extreme funding can indicate crowded positioning.
Sixth, examine realized-profit spikes. Large increases can suggest that holders are distributing into strength.
Support and resistance levels belong in dated technical coverage rather than being frozen into this evergreen article. Those levels change as the chart develops.
A credible XRP price prediction should contain more than a target.
Every useful XRP forecast should identify its drivers. These could include ETF demand, Bitcoin strength, liquidity conditions, XRPL activity, regulatory developments, or broader risk appetite. It should also specify a time horizon. A one-week forecast requires different assumptions from a 2030 scenario.
The forecast should explain the market-cap implication. If approximately 62.5 billion XRP are circulating, a $28 target would imply roughly $1.75 trillion in circulating market value.
Finally, it should state an invalidation point. A forecast without conditions that could prove it wrong is closer to a narrative than a testable market view.
This framework also applies to an AI XRP price prediction.
AI models can process historical prices, liquidity, volatility, and other variables. However, automation does not make a thin forecast reliable. An AI model can still use poor assumptions, stale data, or a time horizon that no longer fits market conditions.
Year-labeled predictions such as XRP price prediction 2026 or XRP price prediction 2030 should therefore be treated as dated scenarios. The method matters more than the year printed beside the target.
Technical analysis can help traders determine timing, but it cannot explain every XRP price movement.
Reliable charts can show trend structure, momentum, volume, volatility, and important reaction zones. Indicators such as RSI, moving averages, triangles, or TD Sequential can add context.
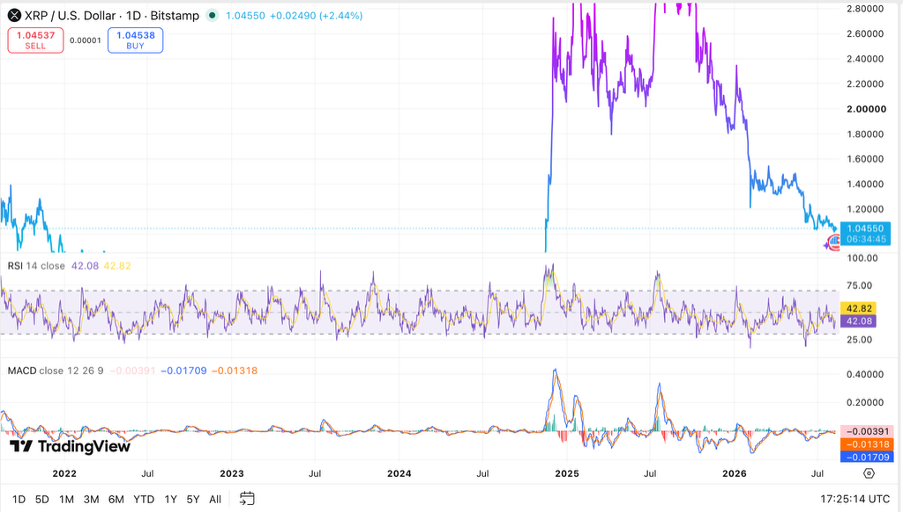
However, a chart post naming one pattern and one price target does not explain the mechanism behind the move.
Technical analysis and trading signals for XRP are most useful when combined with the broader driver checklist.
A technical setup should also include invalidation. If a trader expects a breakout above resistance, the analysis should explain what would make that thesis fail.
Charts are timing-commentary tools. They are not substitutes for fundamental and market-flow analysis.
XRP price is driven less by a single chart pattern and more by recurring market mechanisms. Spot ETF inflows and large-holder accumulation can add demand, but legal milestones and ETF success do not create a permanent floor. Price can still struggle after those headlines.
Prolonged Ripple-SEC uncertainty repeatedly left traders waiting for clarity, which could keep XRP range-bound. The litigation was ultimately resolved in 2025, but its historical influence remains important when interpreting earlier price cycles.
On-chain realized-profit spikes can signal distribution even during rebounds. Large transfers onto exchanges can also shock confidence before any sale is confirmed.
Crowded shorts and negative funding can amplify moves when leverage piles up. XRP can also diverge briefly from a flat Bitcoin or Ethereum tape when network activity and XRPL narratives spike.
When most holders sit in profit, distribution risk can rise as traders lock in gains. None of these signals works reliably in isolation, so the strongest XRP price analysis combines them.
Viral XRP forecasts often skip the hardest part: circulating supply and market-cap math.
Because XRP has a large circulating supply, ambitious dollar targets imply very large valuations. Claims involving $1,000 or multi-thousand-dollar XRP therefore require assumptions about demand and liquidity that many social-media posts never provide.
For example, using approximately 62.5 billion circulating XRP, a $1,000 price would imply about $62.5 trillion in circulating market value.
That calculation does not mean $62.5 trillion of new money must enter XRP. Market capitalization is a valuation metric rather than a direct measure of cumulative capital invested.
Nevertheless, the scale shows why extreme forecasts require substantial evidence.
Attention can surge around unverified narratives involving institutional backing, extreme targets, or supposed supply shortages. Treat those claims as speculation unless they show assumptions, capital requirements, liquidity conditions, and uncertainty.
“Supply shock” slogans for XRP often fail when large balances already sit on exchanges and holders can move coins to trading venues quickly.
Available float and actual market liquidity matter more than scarcity marketing. The relevant question is how much XRP can realistically reach the market at current prices without causing significant slippage.
Escrow releases are a separate supply story. Ripple’s escrow system can affect the potential amount of XRP entering circulation, but scheduled releases do not mean every released token immediately becomes selling pressure.
For price analysis, start with what is actually liquid and ready to trade. Then compare that supply with ETF demand, exchange volumes, whale behavior, and broader market liquidity.
ETF flow data will continue developing into a standing driver alongside legal and whale-flow signals. The key is not simply whether ETFs record inflows. Analysts should compare the size, duration, and direction of those flows with spot prices and broader liquidity.
Prediction content will also continue splitting between method-first analysis and moon-call theater.
Readers can distinguish the two by checking whether a forecast identifies drivers, time horizons, market-cap implications, and invalidation points.
Legal clarity arrived in stages rather than through one simple headline. Future regulatory developments can still test whether an XRP price-floor narrative holds.
The durable lesson is straightforward: liquidity, demand, positioning, and valuation math matter more than viral targets.
Reliable XRP price analysis should identify its data sources, time horizon, drivers, and invalidation points. Avoid forecasts that provide only a target without explaining how XRP could reach it.
Historical XRP price data is available through CoinMarketCap and CoinGecko. CoinMarketCap also provides dated historical snapshots that can help verify older XRP prices.
Use charts that show price, volume, momentum, and relevant market levels. Technical signals are more useful when combined with ETF flows, Bitcoin conditions, leverage, and liquidity data.
Recent weakness can reflect broader crypto-market conditions, reduced demand, profit-taking, and positioning. ETF inflows can remain positive while spot XRP falls if other sources of selling outweigh ETF demand.
They are highly uncertain unless they provide detailed assumptions. A $1,000 XRP price would imply approximately $62.5 trillion in circulating market value using 62.5 billion XRP.
An XRP forecast should consider Bitcoin and crypto-market conditions, ETF demand, liquidity, regulatory developments, XRPL activity, supply, and investor positioning.
Longer horizons require wider scenario ranges because uncertainty increases over time.
No model can establish a guaranteed maximum XRP price. The useful approach is to test different targets against demand, supply, liquidity, and implied market capitalization.
AI models can process large amounts of historical and market data, but they remain dependent on data quality and assumptions.
Research into machine-learning approaches to XRP trading shows that different models can produce different results, reinforcing the need to test assumptions rather than treat AI outputs as certainty.
No. Ripple is a company, while XRP is a digital asset associated with the XRP Ledger.
“Ripple price” is commonly used in searches, but XRP is the traded asset whose market price is being measured, including xrp. Ripple’s official FAQ also distinguishes Ripple as a company from XRP.
No. ETF inflows represent demand from those investment products, but XRP has many other sources of buying and selling pressure.
Recent market periods have shown that ETF demand can coexist with weak XRP price action. This makes flow data a useful context rather than a guaranteed price catalyst.
There is no automatic rule that an escrow release or exchange-balance change must reprice XRP.
The market impact depends on how much XRP becomes available, where it moves, and how demand responds.
The legal narrative became especially important after the SEC filed its Ripple complaint on December 22, 2020.
The 2023 court ruling and 2025 dismissal of the appeals later changed the legal framework surrounding XRP transactions.
What’s Next for XRP Price After the August CPI Data? Analysis
Explore more