
XRP is approaching a critical test at the $2.75 level of resistance. The momentum is waning, and analysts believe that the coin would have to shatter some important levels to continue rewarding.
XRP has been resilient. It increased by over 1 percent today, and Bitcoin and Ethereum decreased. The coin is currently trading around $2.65-2.70 and above the important level of support in the price of $2.62.
Nevertheless, XRP is slowing down, and now it has hit a difficult wall of resistance at approximately 2.75, and has not been able to surpass it since the beginning of October.
This is a significant hurdle that market watchers will point to in order to regain the psychological $3.
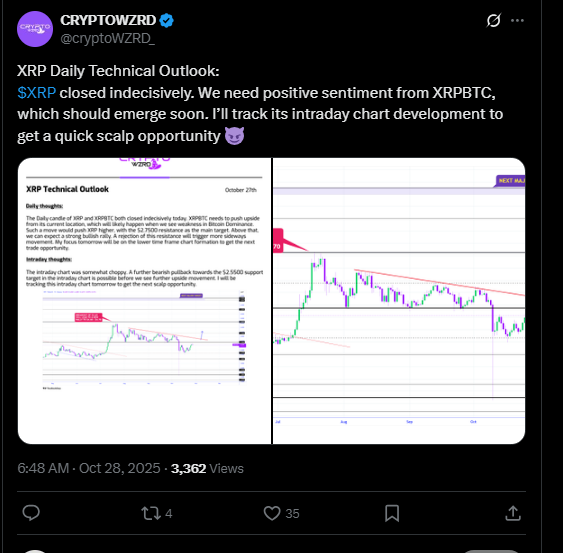
According to technical analyst CRYPTOWZRD on X, a decisive break above 2.75 will help XRP to resume its bullish momentum, and otherwise, it might fall to 2.27 due to the selling pressure.
Source – X
Technical Alerts Signal Cooling Momentum
The chart patterns show the formation of a bearish round top around the resistance, which means weakening purchasing power.
Source –X
According to the technical outlook on Binance, this indicator has alerted that the bulls are feeling fatigued and the sellers are likely to take over in the near future and the down trend may be experienced in case of a breach of the support.
Source – X
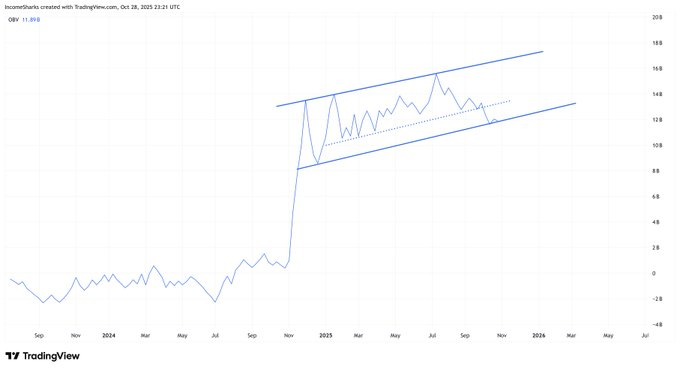
Price is increasing and momentum indicators such as the RSI have been increasing as well, implying that there is healthy short-term strength with no bearish divergence, but the Relative Strength Index is approaching overbought territory, indicating caution.
Investor Attention on ETF and Macro Factors
The investor enthusiasm is still optimistic, regardless of technical issues, as hopes of a Ripple ETF authorization would drive the XRP value forward.
Recent altcoin ETF launches and the expectation of U.S. Federal Reserve rate cuts are also driving positive market sentiment. These macro variables may lead to new purchasing in case XRP breaks resistance.
Nevertheless, should XRP not maintain its support at $2.62, the technical positioning becomes bearish, which explains the significance of these critical levels.
Key Price Levels and Outlook
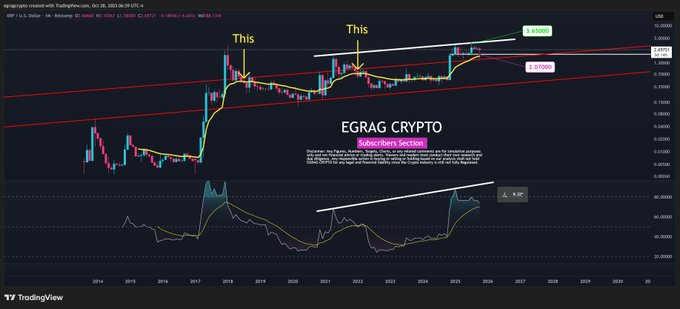
Analysts indicate that $2.62 is the critical support and $2.75 is the major resistance. Breaking resistance can lead to a run to up to $3 and further, whereas breaking support can lead to much lower levels up to 2.27.
Intraday charts indicate a potential ascending wedge, which is usually followed by a massive breakout or breakdown.
Volume and price action should be observed keenly by the traders or those who hold them in attempts to show a change of direction.
The recent test momentum of XRP in the range of the key resistance is a turning point. Its capacity to bear support and overcome resistance will probably dictate its short-term future in the prone and unpredictable crypto markets.
