TD Sequential buy signals emerge on XRP as price consolidates near $2.70, raising hopes for a breakout above $3.00.
XRP is once again at a crucial level as traders weigh the signals from recent technical indicators. The asset is consolidating near $2.70, with new buy signals emerging from the TD Sequential tool, which often precedes trend reversals. Analysts are closely monitoring this setup as XRP forms patterns that could determine its next move.
Consecutive Buy Patterns Indicate Possible Rebound
Market analyst Ali Charts noted on X that the TD Sequential has flashed back-to-back buy signals on XRP. This development is seen by many traders as an early sign that a rebound may be in progress. The signals appear as the token attempts to defend its short-term support around $2.70.
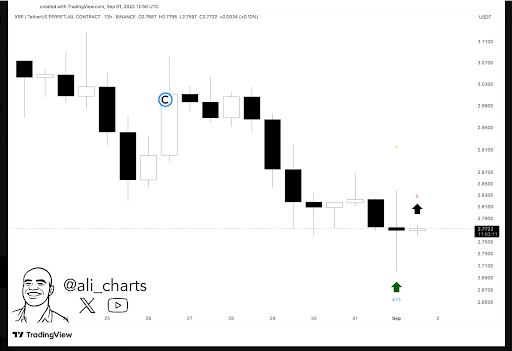
Ali Charts also outlined a bullish path, pointing out that XRP must defend $2.70 and push through $2.90. According to his outlook, if these levels hold, the token could target $3.70 in the near term. Such levels are being watched as potential triggers for stronger upward momentum.
Another key development is the formation of a spinning bottom candle, which often signals indecision before a reversal. Analysts suggest that when paired with the TD Sequential patterns, this structure may strengthen the probability of a price recovery. However, a breakdown below $2.65 would risk exposing the market to lower supports.
Key Support and Resistance Levels
XRP is trading in a narrow range between $2.70 and $2.84, creating a tight consolidation zone. The lower boundary at $2.65 to $2.70 has been defended several times, supported by large whale accumulation. Over the past two weeks, institutional players acquired more than 340 million XRP, reinforcing confidence at these price levels.
The main obstacle remains the resistance zone between $2.80 and $2.84, which has capped recent advances. If XRP breaks through this barrier, analysts suggest the token could extend gains toward $3.00 and then $3.13. Beyond that, the $3.40 region is seen as a potential trigger for a new all-time high.
Moving averages provide further context to the current price structure. The 9-week average sits at $3.04 and acts as short-term resistance, while the 21-week average around $2.57 provides support. The price is now trading between these two levels, reflecting indecision and awaiting confirmation of trend direction.
Trendline Break and Market Uncertainty
Not all analysts are fully confident in the bullish scenario, as XRP has lost a long-term ascending trendline. Technical trader Steph pointed out that the breakdown occurred after failing to hold above the trend, raising caution. His view suggests that if XRP does not reclaim the trendline, further downside could follow.
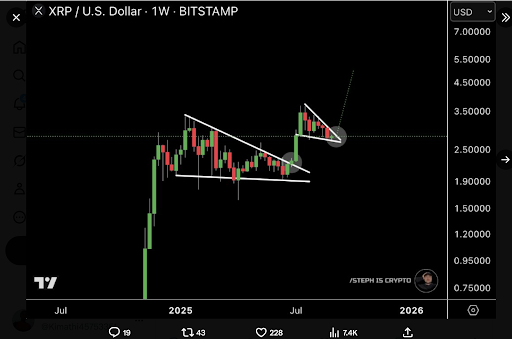
Steph warned that a sustained failure could open the door to deeper retracements, possibly below $2.00. He even projected that a prolonged bearish phase could drive the price into the $0.50 to $0.60 zone if momentum shifts. This outlook contrasts with the bullish setups but reflects the uncertainty still surrounding the asset.
Indicators such as the MACD are also showing mixed signals. The line is slightly above the signal, hinting at a weak bullish crossover. The histogram is near zero, showing that momentum is still undecided and could swing in either direction.

