
XRP trades near $1.29 as $1.30–$1.05 Fibonacci zone and $1 support decide next move toward $0.80 or recovery above $1.36.
XRP remains under pressure on the daily timeframe as traders watch a critical Fibonacci zone between $1.30 and $1.05.
Market participants are focused on whether this range can hold as support or open the door to deeper losses.
Recent price action shows the asset trading near $1.29 after a strong red daily close.
Daily Trend Remains Bearish Below Key Resistance
XRP/USD on the Bitstamp daily chart shows a clear corrective phase after peaking above $3.00 in early 2025.
Since that high, the structure has shifted to lower highs and lower lows. Momentum indicators continue to reflect sustained downside pressure.
The asset is trading below the 0.236 Fibonacci retracement near $1.36. This level now acts as immediate resistance.
A daily close above $1.36 would weaken the short-term bearish structure, but price has so far failed to reclaim it.
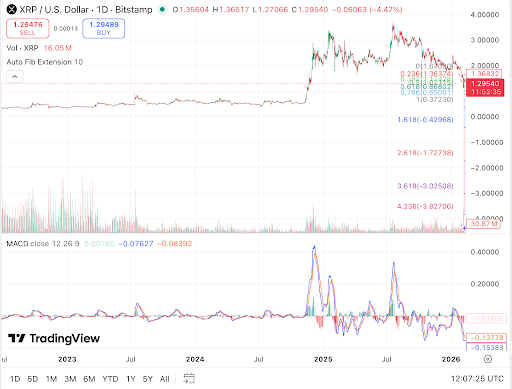
MACD on the daily chart remains in negative territory. The histogram continues to print red bars, and no confirmed bullish crossover is visible.
Volume during the recent decline has stayed elevated, suggesting active selling rather than low liquidity drift.
$1.30–$1.05 Fibonacci Zone in Focus
Technical analysts are closely monitoring the Fibonacci demand pockets between $1.30 and $1.05.
This range includes the 0.382 retracement near $1.02 and aligns with prior consolidation areas.
It also sits above the 0.5 and 0.618 retracement levels measured from the major swing.
$XRP: Between $1.30/$1.05 sit key FIB demand pockets (0.5/0.618). If a macro low can hold above, validation to higher targets increases. Lose $1. $0.80/$0.70 is the next logical target. pic.twitter.com/spDKJI5nRM
— 🇬🇧 ChartNerd 📊 (@ChartNerdTA) February 28, 2026
The current price near $1.29 places XRP at the upper boundary of this demand zone.
If the market forms a macro low above this region, it could provide validation for a recovery attempt toward higher resistance levels.
However, a daily close below $1.25 would increase the risk of a move toward $1.02. That level marks the 0.382 Fibonacci retracement and serves as the next major technical reference. Traders are watching closely for confirmation through candle structure and volume.
Related Reading: XRP’s Multi-Year Triangle Breakout Signals $6–$10 Target
Risk of Breakdown Toward $0.80–$0.70
If XRP loses the $1.00 psychological level, technical models point to lower targets.
Analysts note that a sustained break under $1 could shift focus toward the $0.80 and $0.70 range. These levels align with deeper retracement areas near 0.5 and 0.618.
The $0.86 zone represents the 0.5 Fibonacci retracement, while $0.68 sits near the 0.618 level.
These areas are often monitored during corrective phases following parabolic rallies. A move into this range would still fall within historical retracement norms.
For now, the $1.30–$1.05 zone remains the central decision point. Holding above this band could stabilize price action and support a gradual recovery.
Losing it may extend the corrective structure and shift attention to lower Fibonacci targets.

