
XRP declines to support $1.90 amid negative funding rates. Shorts and on-chain velocity are at 2024 highs, indicating big whale movements.
XRP slipped 1.3% to trade at $2.13. The token prolonged a one-week drop, which shifted prices down 3.5 percent. It is currently down 40 percent from its July high of $3.65.
Spot volume went down 27% to $3.41 billion per day. The traders are reducing exposure because momentum is weakening throughout the market.
Shorts Pile Up as Funding Turns Deeply Negative
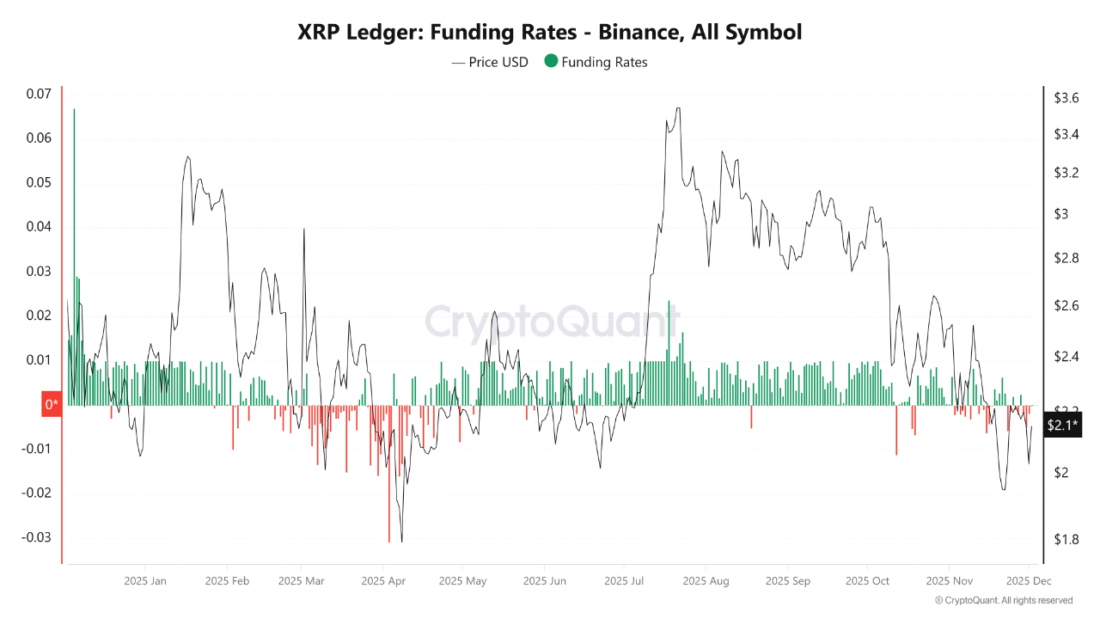
Source: CryptoQuant
The funding rates have remained negative for a number of days. Shorts are now much greater than longs according to CryptoQuant contributor PelinayPA. This arrangement validates the pressure to the downside that is apparent in price charts.
Negative funding shows that more short positions prevail, PelinayPA observed. The market is opening downside, and the long appetite has not been strong.
The structure enhances the likelihood of the XRP revisiting the 2.0 to 1.90 range. In the case of a fund below -0.01, the token may fall to 1.90. Nevertheless, a further decline in the rates of funding may cause a momentary excursion to 2.25-2.35 as shorts scramble to close.
You might also like: XRP Breakout: Triangle Pattern Signals Major Rally
Whale Activity Explodes to Yearly Highs
The Coin Bureau noted the spike on X, saying that the XRP velocity indicates an increase in liquidity and high-volume trader or whale action. The post referred to data on CryptoQuant indicating spikes in vertical activity.
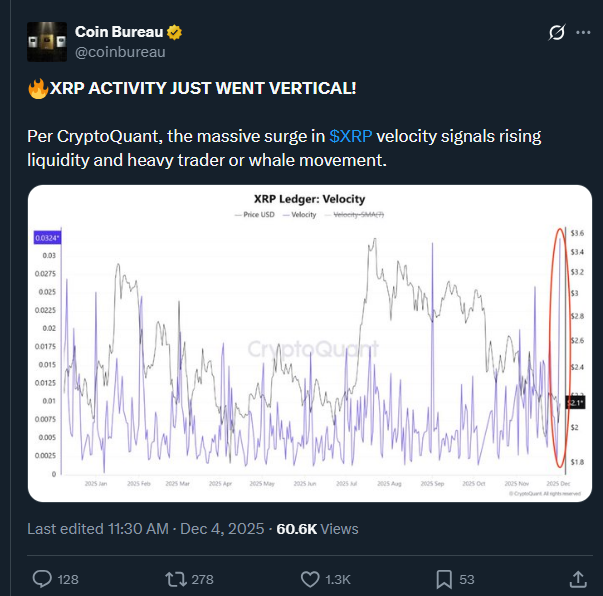
Source: Coin Bureau
According to the analysis of CryptoOnChain, the highest velocity of XRP was recorded as 0.0324 on December 2. This is the peak of 2024. The measure is the speed at which the tokens circulate within the network.
Higher speed signifies heavy use. Whales and traders are exchanging coins faster than they were in previous months. This implies either distribution or repositioning among large holders.
You might also like: XRP News: XRP Tests $2 as Bulls Fight Bears
Technical Setup Confirms Bearish Bias
XRP is still stuck under the 50-day, 100-day, and 200-day moving averages. The average of 20 days is near the prevailing prices but failed to turn bullish. The broader trend remains towards the downside.
Bollinger Bands have become tighter with less volatility. Price has difficulty breaking out of the high band and is floating around the center. Further selling would drive XRP to the lower band towards $1.96.
The MACD indicates an early bullish crossover. The signal is, however, weak. The RSI is neutral at 48, and it does not show any directional bias.
Support levels sit at $2.00 and $1.90. Resistance lies near $2.25 and $2.35. Breaking the upper Bollinger band above would be an indicator of renewed power. A fall below 2.00 would probably bring about another cycle of low activity.

