

Algorand sits a few cents above the all-time low it set back in March, and the six-timeframe chart shows a coin stuck between chop and a slow bleed.
Pulled up the ALGOUSDT chart this week, and honestly the first thing worth flagging has nothing to do with trend lines. Algorand’s trading something like three and a half percent above its all-time low, which isn’t exactly a flex for a coin that once changed hands above three dollars.
And that low isn’t some 2020 relic either. It printed March 29, four months back now. $0.0797, if you’re curious. Price has mostly just failed to get away from it since.
Still Living Off a 2019 Peak
Zoom out to the monthly chart and there’s a number that does a lot of the talking, 97.7 percent, that’s roughly the gap between where ALGO sits now and the $3.56 it touched back in June of 2019. Seven years later and this thing is still getting introduced by its worst chart, which feels almost unfair at this point.
Monthly RSI, for what it’s worth, reads 43.
Below fifty. Drifting. No divergence forming against price that I can see, at least not yet. That’s not oversold so much as it’s just tired, the kind of reading you get when a chart’s been losing altitude for so long that nobody’s really bothering to buy the dip anymore, they’ve moved on.
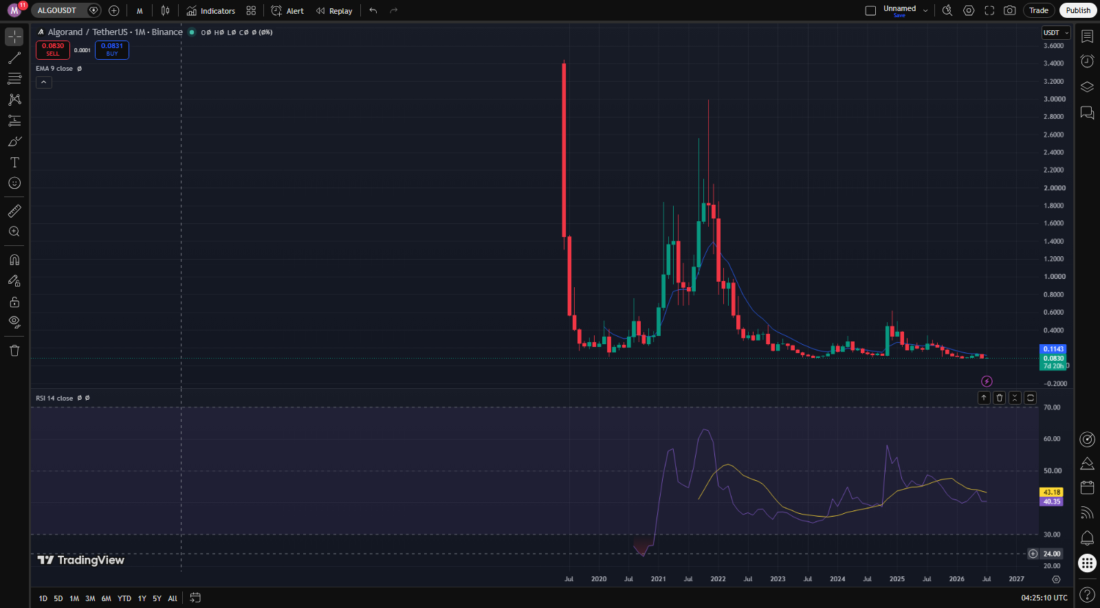
Algorand (ALGOUSDT) Monthly chart. Source: TradingView / Binance.
The Slow Bleed Since Last Summer
Weekly is basically the same story, just with more detail filled in. ALGO topped somewhere near sixty cents in mid-2023 and has been grinding lower pretty much nonstop since, an almost uninterrupted stair-step down that only really paused once, a brief spike toward fifty cents in late 2024 before it rolled right back over and kept going.
Weekly RSI’s sitting around 36 to 40 these days. Bearish, sure, though it’s not the kind of low-twenties reading that screams capitulation.
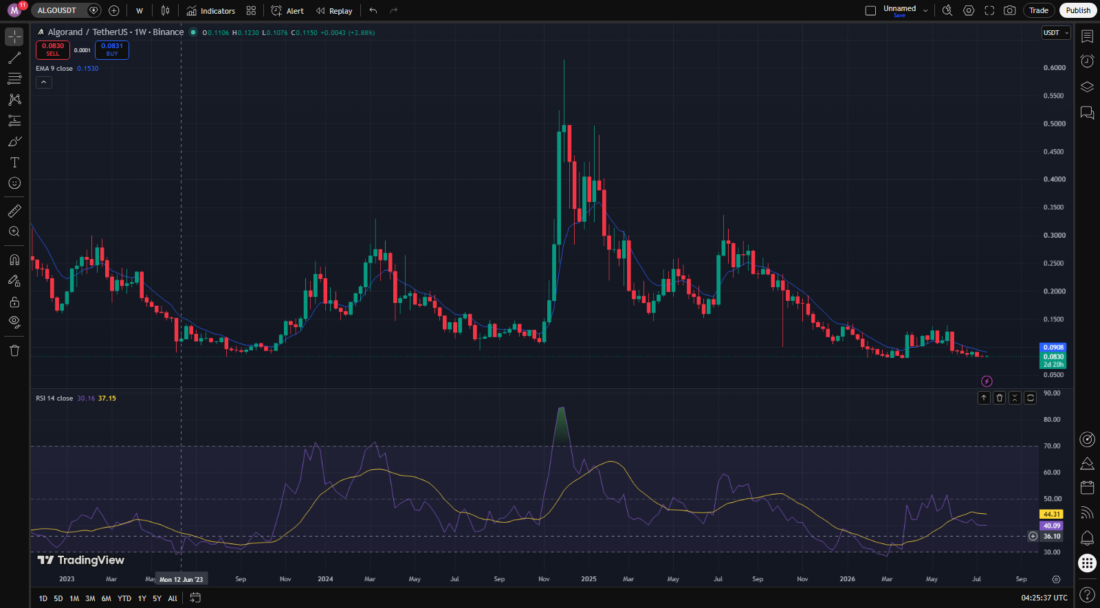
Algorand (ALGOUSDT) Weekly chart. Source: TradingView / Binance.
Stuck Below Nine Cents Since June
Daily’s where the range starts mattering more than the trend does. ALGO tried breaking out in May, spiked to $0.135, got rejected. Tried again in June, this time near $0.104, and got rejected even harder. Since then it’s basically been boxed in, eight cents on one side, nine on the other.
Daily RSI sits at 41, right up against the underside of neutral. Price is also trading below its own 9-day EMA, which lines up around $0.0954 right now, well above where the coin actually changes hands. Another way of putting it, the short-term trend hasn’t turned yet, even though the selling pressure itself has clearly eased off some.
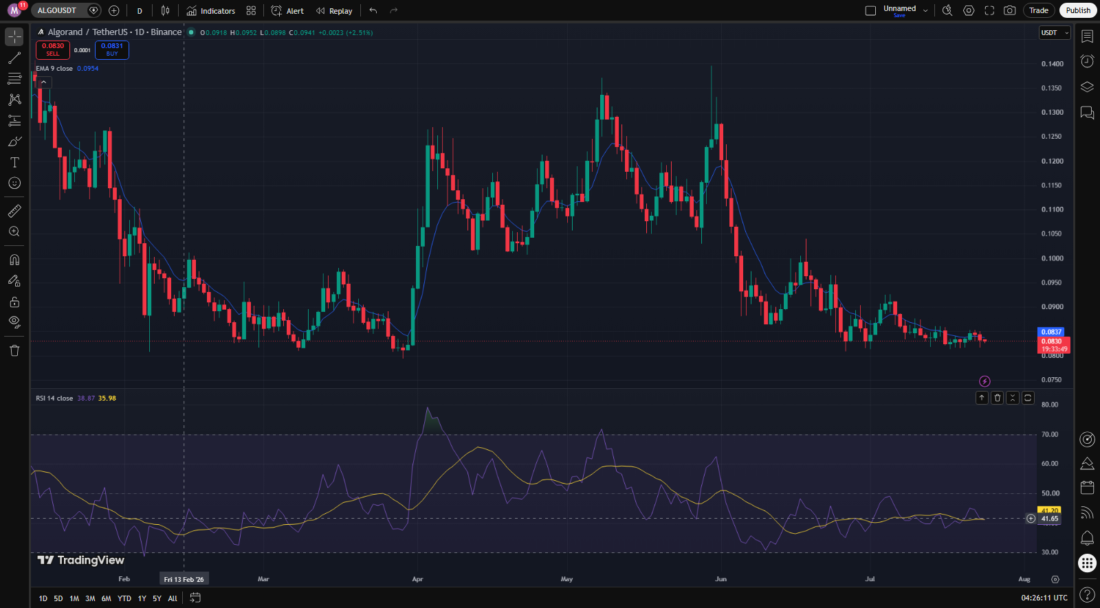
Algorand (ALGOUSDT) Daily chart. Source: TradingView / Binance.
Four Weeks of Going Absolutely Nowhere
Drop down to the 4-hour chart and the range tightens up even more, something like eight point two cents on the low side, eight point eight on the high side, and it’s basically held there for close to a month straight. RSI keeps swinging from the high 30s up to the mid 60s and back again, inside that same narrow band, over and over.
That’s chop, plain and simple. Not a trend. Not really accumulation either, not in any way you could point to with confidence. Just a market that hasn’t made up its mind.
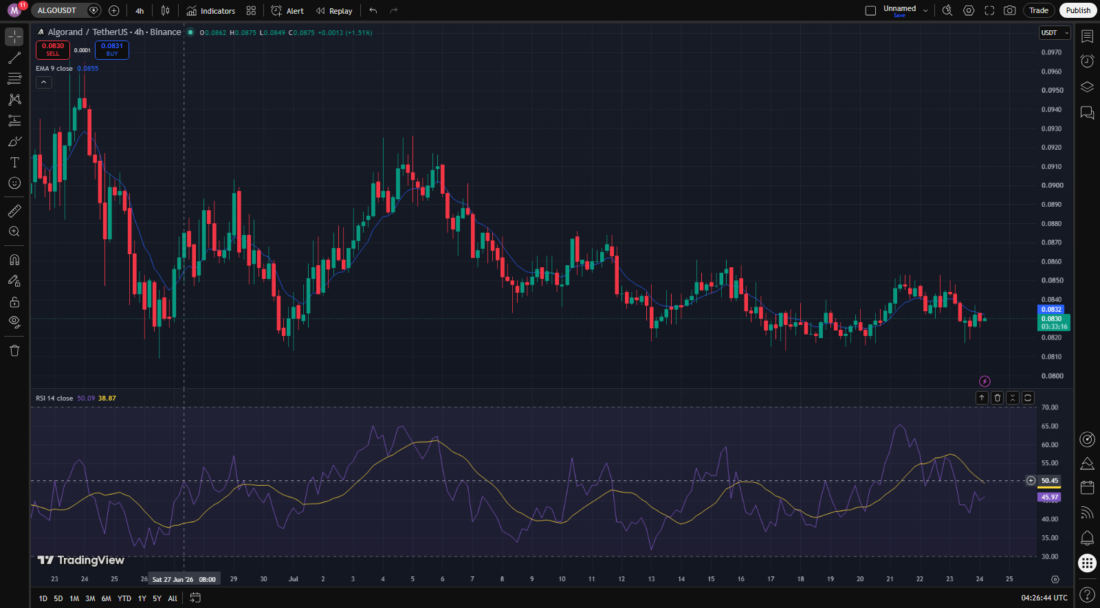
Algorand (ALGOUSDT) 4-hour chart. Source: TradingView / Binance.
The Dip That Got Bought Back Fast
Here’s where it actually gets interesting though, the last day or so. Price knifed down to $0.0818 on the 15-minute chart, dragged RSI under 20 in the process, properly oversold territory, and then clawed the whole move back within a handful of candles. It’s trading back around $0.083 now, RSI near 55.
Zoom out one step to the hourly and that same reclaim shows up as a bounce off the floor of a range that’s held since July 17, roughly $0.0815 up to $0.0854. Worth keeping an eye on, though let’s be honest, one bounce off one oversold reading on a 15-minute chart doesn’t really prove much of anything bigger is coming.
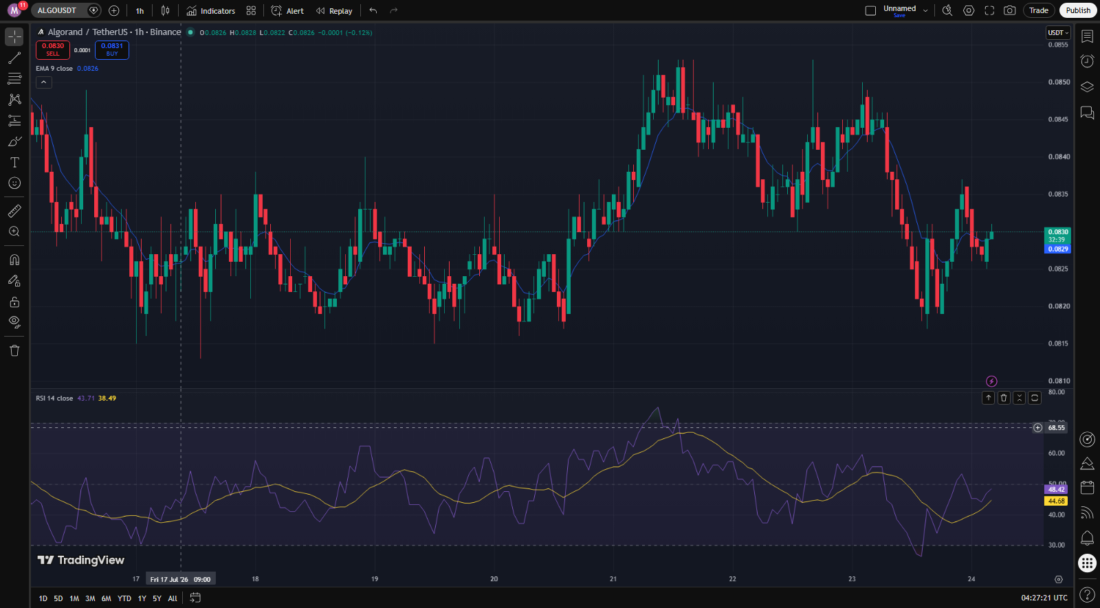
Algorand (ALGOUSDT) 1-hour chart. Source: TradingView / Binance.
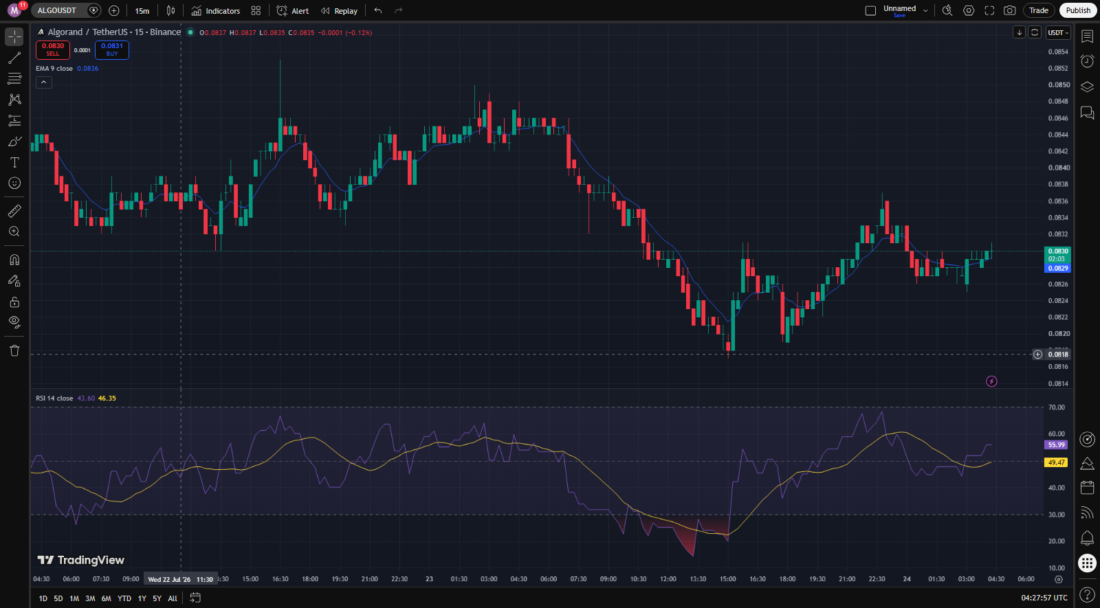
Algorand (ALGOUSDT) 15-minute chart. Source: TradingView / Binance.
What the Volume Numbers Actually Say
CoinGecko‘s got ALGO down 1.9 percent on the day, up a touch under one percent across the past week, which actually puts it behind both the broader crypto market and its Smart Contract Platform peers over that same stretch. Thirty-day performance is worse still, down close to 13 percent. The one-year number, though- that one’s just brutal, negative 69 percent.
Volume over the last 24 hours landed around $18.3 million, itself down almost 3 percent from the day before, so activity’s thinning a bit too. Market cap holds near $743 million, good enough for the 77th spot on the rankings at the moment, with OKX and Binance handling most of the actual ALGO/USDT flow.
Whatever happens next probably just comes down to one number, that $0.0797 low from back in March. ALGO’s spent four months now failing to put real distance between itself and that level, and the chart as it sits today- chop up top, a fresh bounce down below- doesn’t say a whole lot about which way this eventually breaks.


Leave a Reply
You must be logged in to post a comment.