
Bear market bottom confirmation on Bitcoin is absent. The SOPR Ratio sits at 0.9, well above the 0.55 floor that ended every prior cycle.
The ratio was 0.9 when the analysis dropped. That number matters more than most people realize.
A CryptoQuant analyst published findings Thursday pointing to the LTH-SOPR to STH-SOPR ratio as the single most consistent structural marker in Bitcoin’s bear market history. The argument is not about price. It is about who is selling at a profit and by how much.
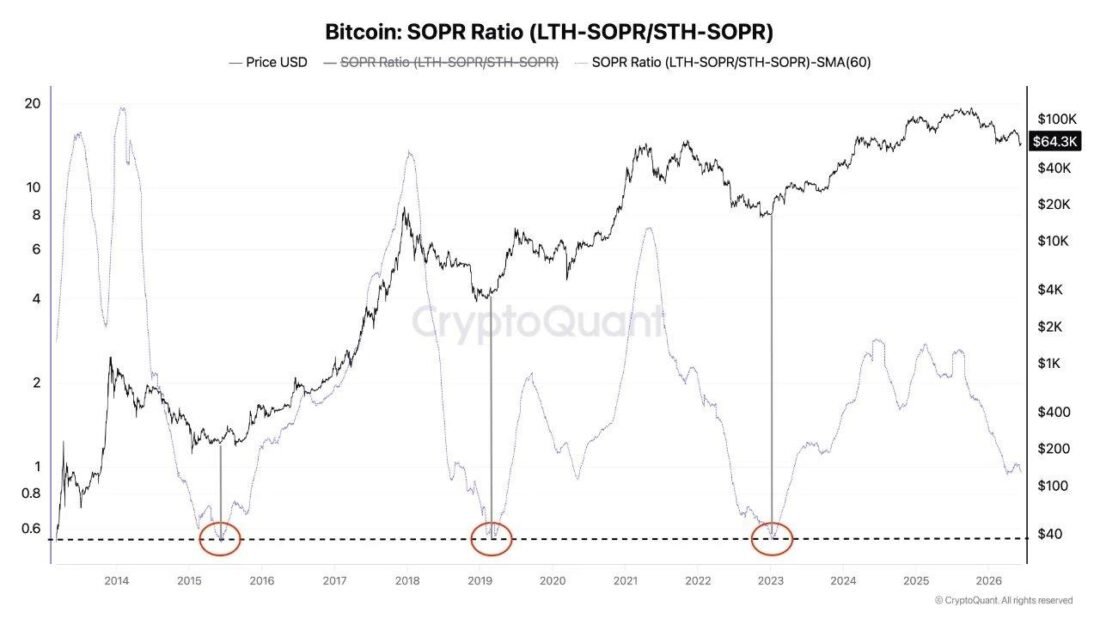
Source: CryptoQuant — Bitcoin SOPR Ratio (LTH-SOPR/STH-SOPR)
A Ratio Nobody Watches Until It’s Too Late
The SOPR Ratio measures the profit spread between long-term holders and their short-term counterparts. When the 60-day moving average of that ratio compresses to approximately 0.55, per CryptoQuant data, every prior bear cycle has ended. Not approximately ended. Ended.
Long-term holders tend to stop distributing near a genuine bottom. Their conviction holds. Meanwhile, short-term holders who bought the dip are sitting on thin gains, keeping their SOPR reading elevated. Those two forces squeeze the ratio downward. That compression to around 0.5, the point where the profit gap between veterans and newcomers fully inverts, is what the market has needed each time.
The actual price bottom usually arrives before the SMA60 reaches 0.55. The indicator is a rear-view confirmation, not a live entry signal. That distinction matters more than the number itself.
What 0.9 Actually Means Right Now
At 0.9, long-term holders still hold a profit edge over newer entrants. The gap is narrowing. But narrowing is not the same as inverted.
CryptoQuant’s analysis does not stop at the ratio. The Coinbase Premium has remained persistently negative alongside it. Weak open interest is contributing to the picture. The NRPL moving average is declining. Individually these are soft signals. Together they sketch the same outline.
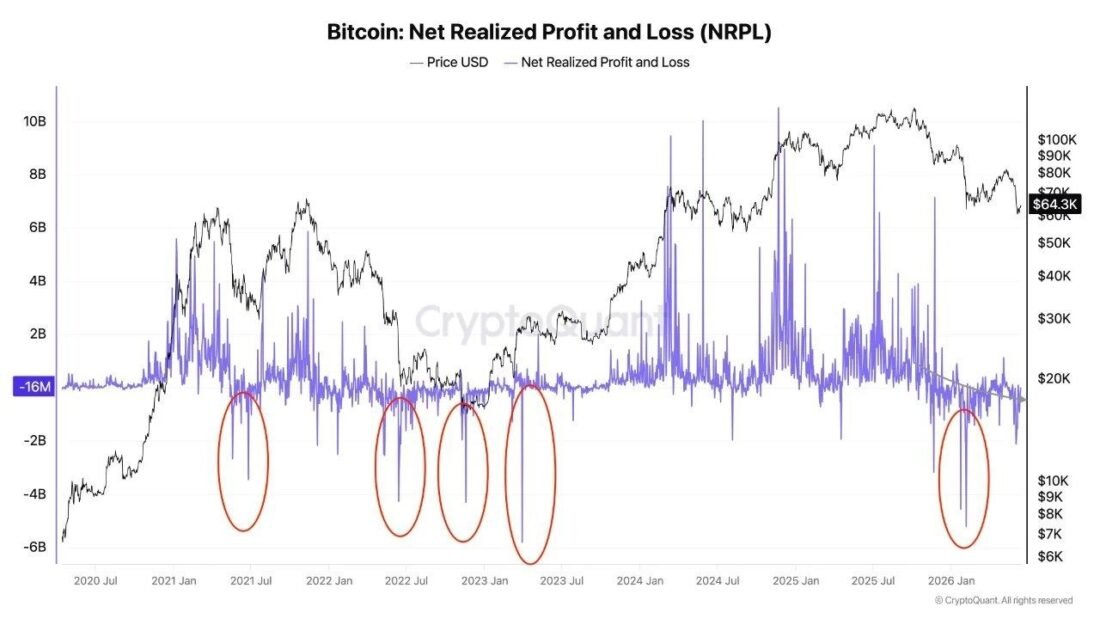
Source: CryptoQuant — Bitcoin Net Realized Profit and Loss (NRPL)
The NRPL chart shows spikes deep into negative territory across early 2022, late 2022 into 2023, and again in early 2026. Each circled cluster corresponds to phases where realized losses peaked. The current 2026 reading dipped below negative $6 billion. The bear market structure is intact.
Three Cycles. Three Circles. One Pattern.
The SOPR chart marks three red circles across 2015, 2019, and 2023. Each one landed near the SMA60 floor of 0.55. Each one preceded a multi-cycle recovery. The price low and the structural confirmation arrived in the same window, though not on the same day.
What the 2015 bottom had that the current market does not is full inversion. LTHs were selling at a loss. STHs were barely profitable. The gap closed completely. The 2023 bottom printed a similar setup. CryptoQuant described those moments as the point when true believers stopped selling because they had already decided to hold through anything.
The market has not reached that point. The ratio needs to compress considerably more before that structural signal fires.


Leave a Reply
You must be logged in to post a comment.