Binance recently broke to the upside of a previous consolidation pattern only to complete a pullback to a longer-term downtrend line. This was close to the longer-term moving average and the 0.00030 mark, which likely drew sellers in.
The short-term MA is below the long-term MA on the hourly chart so the path of least resistance is to the downside, which means that the selloff is likely to continue. The gap is also widening to reflect strengthening selling pressure. However, stochastic is already indicating oversold conditions on this time frame, which signals that buyers might take over from here.

On the 15-minute chart, it can be seen that Binance broke below a short-term consolidation pattern to reflect a pickup in selling momentum. This pattern spans 0.000325 to 0.000275 so the resulting selloff could last by 0.00005 or the same height as the formation. Volume has ticked higher to indicate increased investor interest but stochastic is also indicating oversold conditions, which means that buying pressure could return sooner or later.

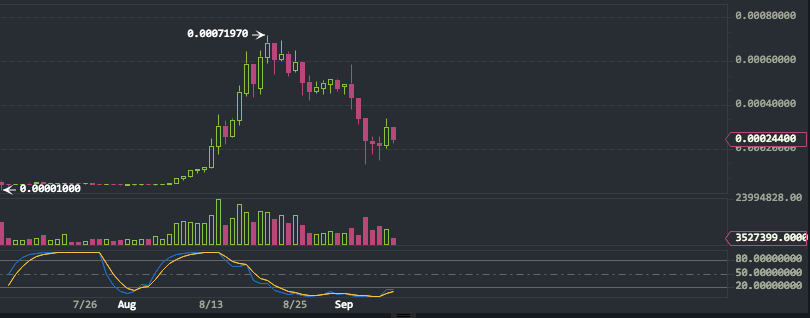
Lastly, looking at the daily time frame shows that the downtrend is still intact and that the highs since mid-August can be connected with a descending trend line. If this continues to hold, Binance could drop until the spikes lower or create new lows.
As in short-term time frames, though, stochastic is also indicating oversold conditions on the daily chart and the oscillator looks ready to pull up. In that case, Binance could make another attempt to break above the trend line and spur a reversal. After all, the recent slide also appears to be a 61.8% correction off the earlier rally since the start of August.

Binance is an up and coming Chinese exchange but it has its own cryptocurrency. These tokens were created by an Ethereum smart contract some time ago and a total of 80m BNB coins is kept in reserve, all of which belong to the team. A total of 200m coins were created initially so there are 120m BNB coins waiting to be traded.


