- Bitcoin cash price settled below the key $250 support against the US Dollar.
- The price is currently consolidating above the $210 support and below the 55 simple moving average (4-hours).
- There is a crucial contracting triangle forming with resistance near $228 on the 4-hours chart of the BCH/USD pair (data feed from Coinbase).
- The pair could either rally above the $230 resistance or decline heavily below $210-$200.
Bitcoin cash price is trading in a range above $210 and preparing for the next move against the US Dollar. BCH/USD could recover nicely if it clears the $230 resistance level.
Bitcoin Cash Price Analysis
This past week, we saw a sharp decline in bitcoin cash price below the $260 support against the US Dollar. BCH price even settled well below the $250 support and the 55 simple moving average (4-hours).
The pair traded close to the $200 support and a low is formed near the $205 level. Recently, there was a minor upside correction above the $215 level. The price even attempted to clear the 23.6% Fib retracement level of the downward move from the $297 high to $205 low.
However, the price seems to be facing a strong resistance near the $230 level and the 55 simple moving average (4-hours). There is also a crucial contracting triangle forming with resistance near $228 on the 4-hours chart of the BCH/USD pair.
The pair must break the triangle resistance, $230, and the 55 simple moving average (4-hours) to start a strong recovery in the near term. The next major resistance on the upside is near the $250 level.
The 50% Fib retracement level of the downward move from the $297 high to $205 low is also near the $250 level to prevent gains. Any further gains could lead the price towards the $280 resistance. Conversely, the price may perhaps continue to move down below the $215 support.
If there is a bearish break below the triangle support and $215, there is a risk of a sharp decline below the main $200 support in the coming sessions.
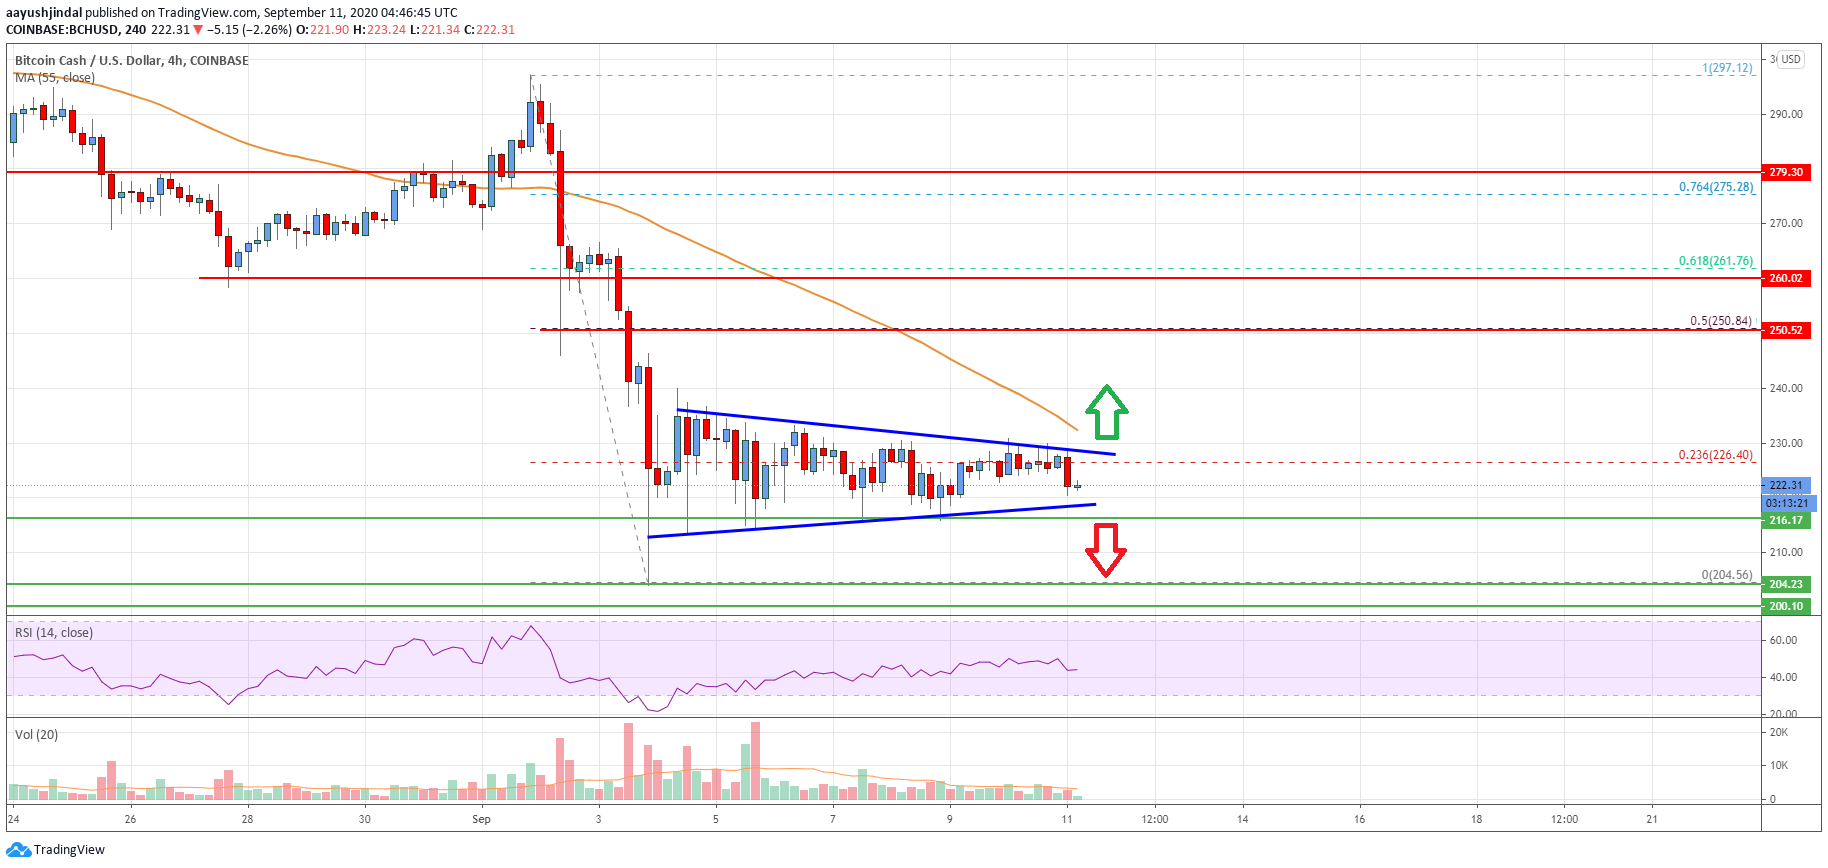
Looking at the chart, bitcoin cash price is clearly consolidating above the $210 support and preparing for the next move. The price could either rally above the $230 resistance or decline heavily below $210-$200.
Technical indicators
4 hours MACD – The MACD for BCH/USD is currently showing no major bullish sign.
4 hours RSI (Relative Strength Index) – The RSI for BCH/USD is still well below the 50 level.
Key Support Levels – $215 and $200.
Key Resistance Levels – $230 and $250.