- Bitcoin cash price started a major decline from well above the $260 support against the US Dollar.
- The price is currently trading well below the $25 support and the 55 simple moving average (4-hours).
- There was a break below a crucial bullish trend line with support near $275 on the 4-hours chart of the BCH/USD pair (data feed from Coinbase).
- The pair could correct higher in the short-term, but there is a risk of more losses below $200.
Bitcoin cash price is declining and it is trading in a bearish zone below $250 against the US Dollar. BCH/USD is showing bearish signs and the bears might even attempt a break below $200.
Bitcoin Cash Price Analysis
In the past few sessions, there was a sharp decline in bitcoin cash price from well above $260 against the US Dollar. BCH price even traded below the $250 support and the 55 simple moving average (4-hours).
The decline was such that the price broke the $220 support and traded close to the $200 handle. During the decline, there was a break below a crucial bullish trend line with support near $275 on the 4-hours chart of the BCH/USD pair.
A new weekly low is formed near $204 and the price is currently correcting higher. It recovered above the $215 level, but facing hurdles near the $226 level. It is close to the 23.6% Fib retracement level of the recent drop from the $297 high to $205 low.
The first major resistance is near the $240 level. The main resistance is now forming near the $250 level. It is close to the 50% Fib retracement level of the recent drop from the $297 high to $205 low.
If there is an upside correction, bitcoin cash might find it difficult to clear the $240 and $250 resistance levels. Conversely, the price may perhaps continue to move down below the $215 support. The next major support is near the $205 and $200 levels.
If there is a bearish close below the $200 support, there could be a massive drop towards the $180 support or even $165 in the coming days.
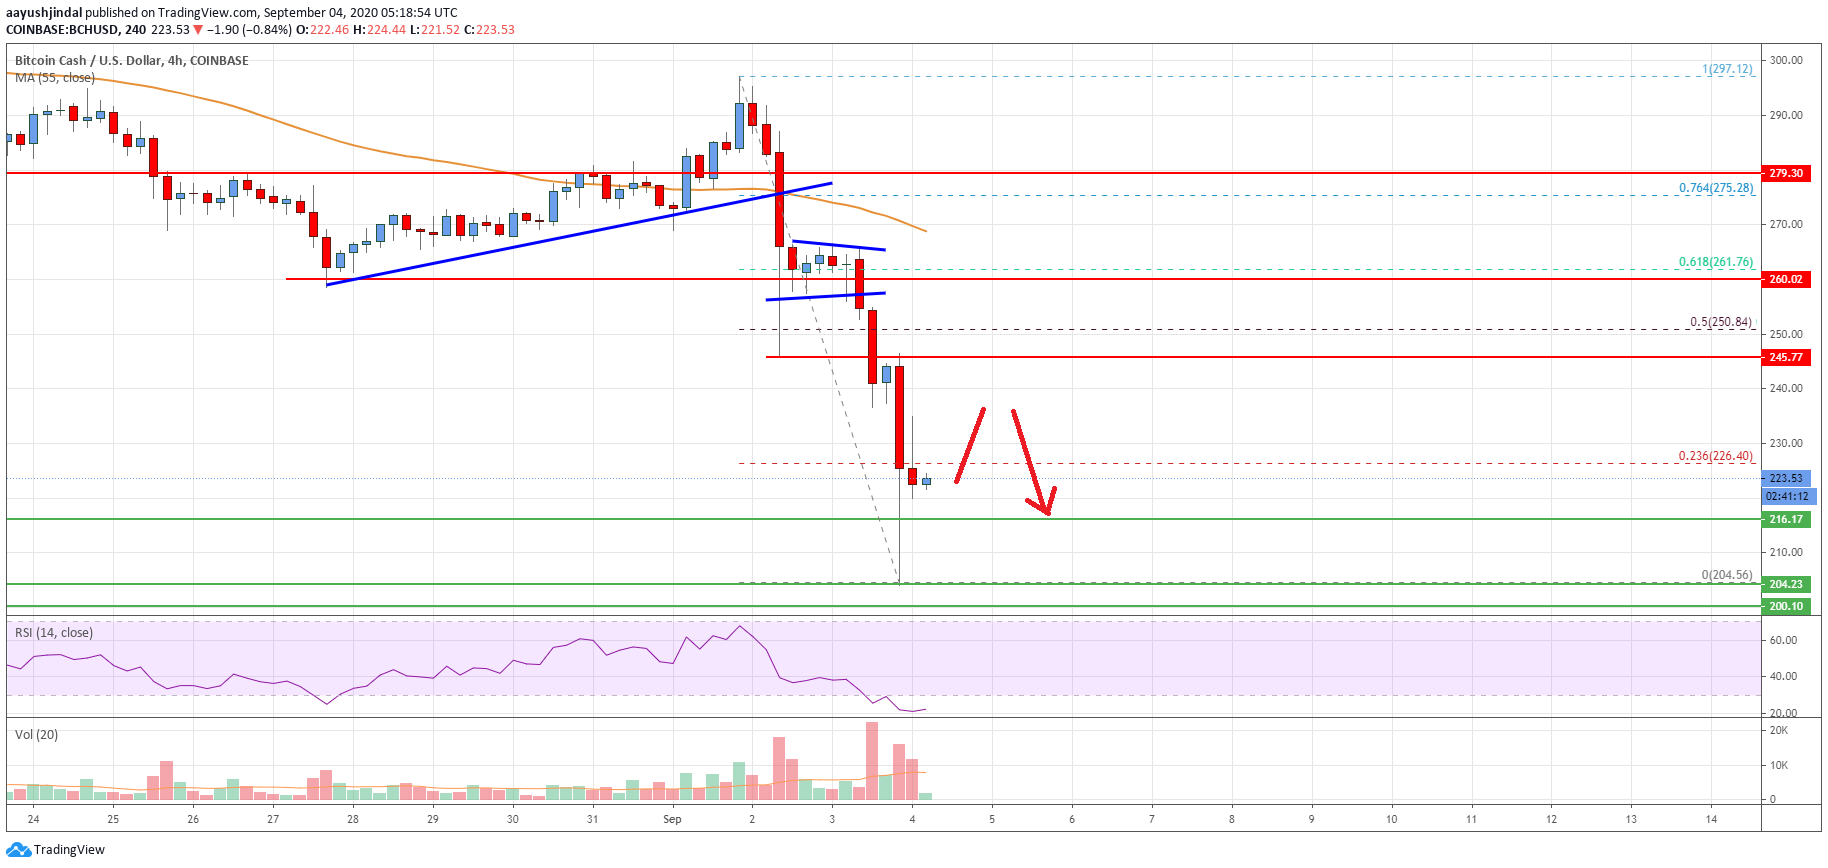
Looking at the chart, bitcoin cash price is clearly trading in a bearish zone below $240 and $250. The price could correct higher in the short-term, but there is a risk of more losses below $200.
Technical indicators
4 hours MACD – The MACD for BCH/USD is currently losing momentum in the bearish zone.
4 hours RSI (Relative Strength Index) – The RSI for BCH/USD is currently well below the 30 level.
Key Support Levels – $205 and $200.
Key Resistance Levels – $240 and $250.
