- Bitcoin cash price declined sharply and even broke the $300 support against the US Dollar.
- The price traded towards the $250 support level and it is currently correcting higher.
- There is a crucial bearish trend line forming with resistance near $340 on the 4-hours chart of the BCH/USD pair (data feed from Kraken).
- The pair could struggle to break the key $320, $330 and $340 resistance levels in the near term.
Bitcoin cash price is correcting from the $260 support area against the US Dollar. However, BCH price might find it difficult to continue higher above the $330 and $340 resistances.
Bitcoin Cash Price Analysis
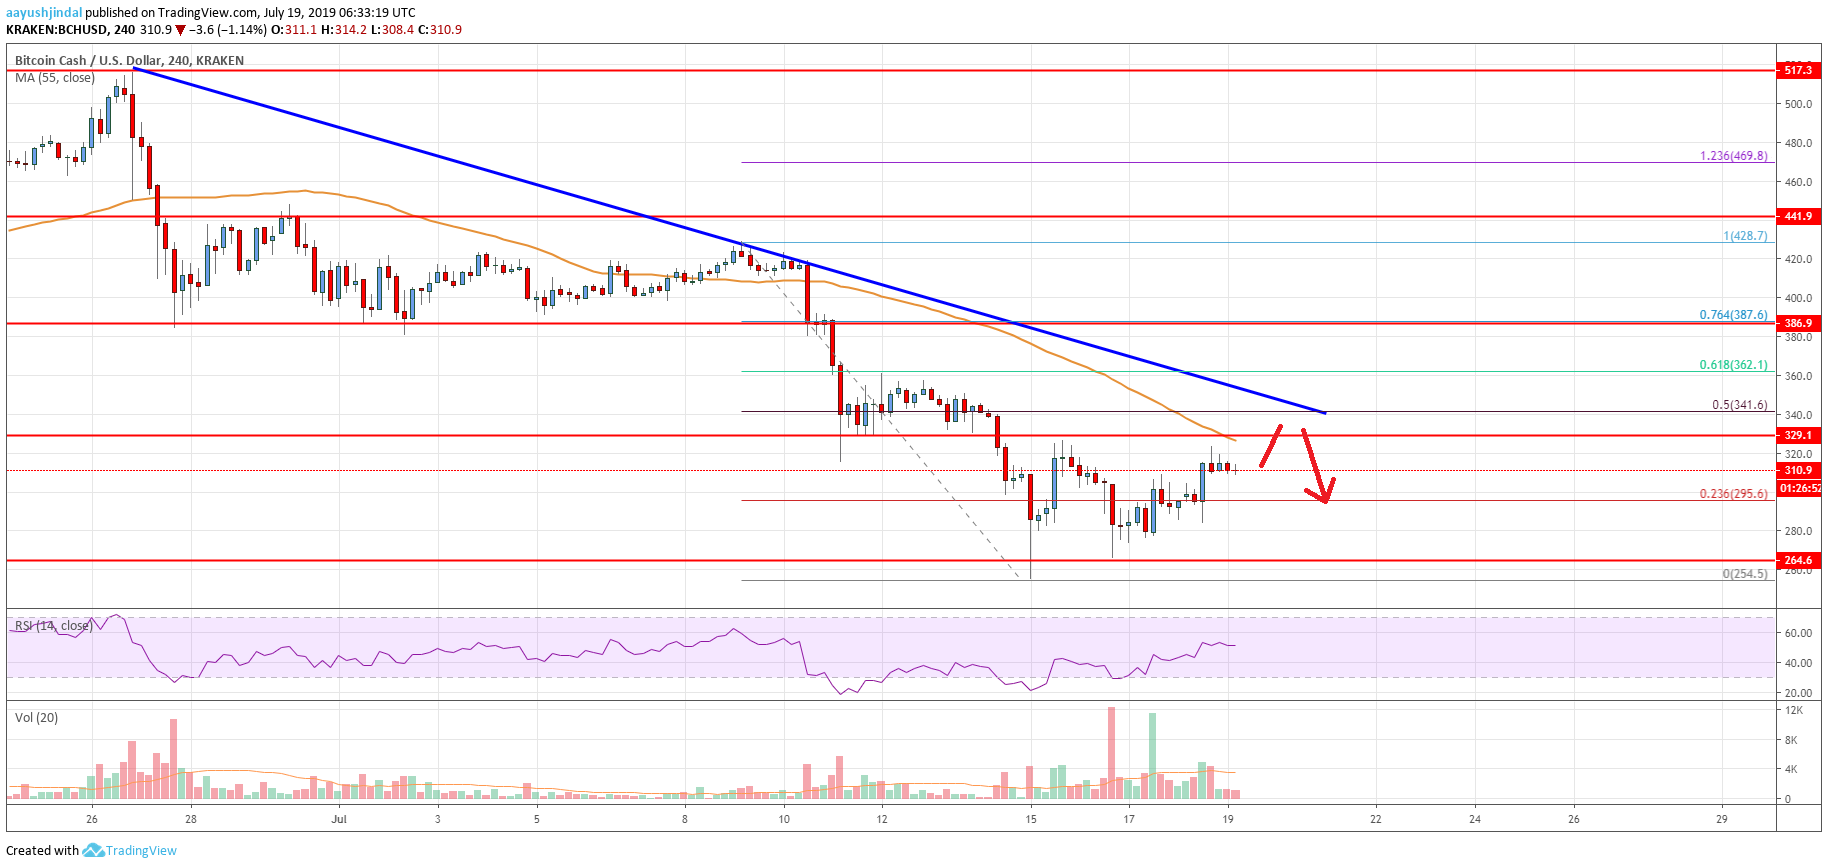
This week, there was a strong decline in bitcoin cash price after it broke the $340 support area against the US Dollar. The BCH/USD pair even broke the $300 support and settled well below the 55 simple moving average (4-hours). The decline was such that the price spiked below the $280 support level and traded close to the $250 level. A new monthly low was formed near $254 and the price recently started an upside correction.
There was a break above the $280 resistance plus the 23.6% Fib retracement level of the last major drop from the $428 high to $254 swing low. However, the price is facing a lot of hurdles near the $320 and $330 levels. Moreover, the 55 simple moving average (4-hours) is also near the $330 level to act as a resistance. More importantly, there is a crucial bearish trend line forming with resistance near $340 on the 4-hours chart of the BCH/USD pair.
The 50% Fib retracement level of the last major drop from the $428 high to $254 swing low is also near the $340 level to act as solid resistance. Therefore, the bulls may face a lot of selling interest near the $330 and $340 levels. To start a fresh increase, the price must settle above $340 and the 55 simple moving average (4-hours). The next main resistance is near the $385 level plus the 76.4% Fib retracement level of the last major drop from the $428 high to $254 swing low.
On the downside, an immediate support is near the $300 level. If there are more losses, the price resume its decline below the $280 support level. The main supports on the downside are near the $260 and $250 levels.

Looking at the chart, bitcoin cash price is currently correcting higher, but the $330 and $340 levels are significant barriers. Therefore, the price could either climb further above $350 or resume its decline below $300.
Technical indicators
4 hours MACD – The MACD for BCH/USD is currently losing momentum in the bullish zone.
4 hours RSI (Relative Strength Index) – The RSI for BCH/USD is currently struggling to stay above the 50 level.
Key Support Levels – $300 and $280.
Key Resistance Levels – $330 and $340.


Leave a Reply
You must be logged in to post a comment.