- Bitcoin cash price declined heavily and broke the $350 support level against the US Dollar.
- The price traded towards the $310 level and it is currently consolidating losses.
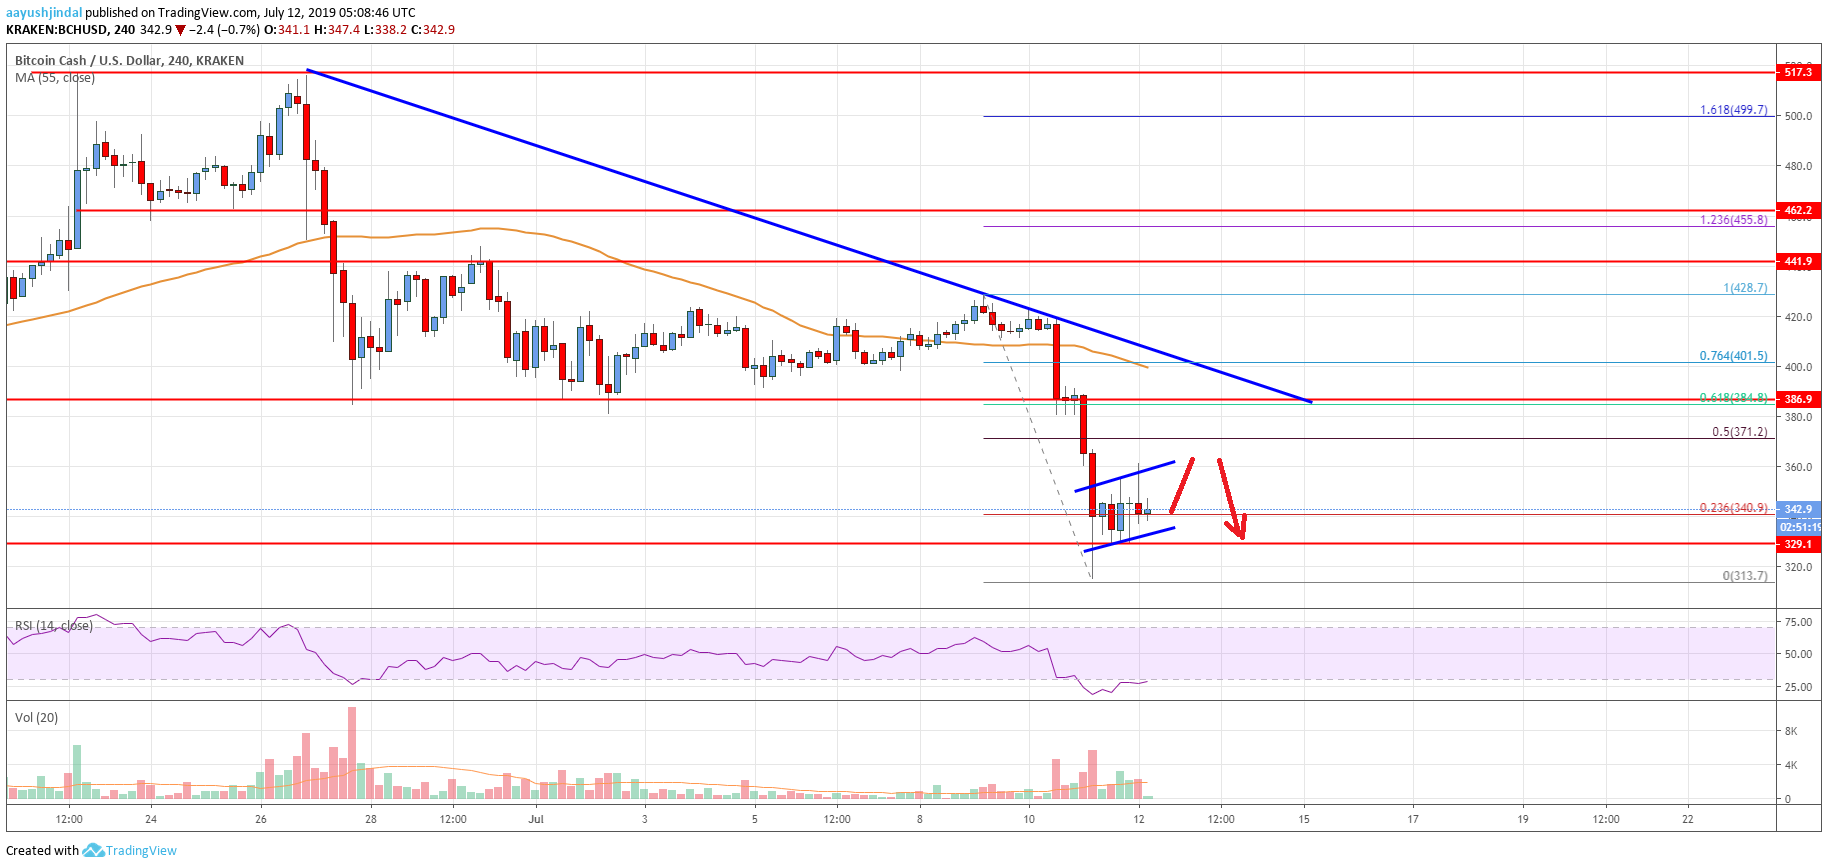
- There is a major bearish trend line forming with resistance near $385 on the 4-hours chart of the BCH/USD pair (data feed from Kraken).
- The pair remains at a risk of more losses if there is a break below the $320 and $310 supports.
Bitcoin cash price is trading in a bearish zone below $350 and $380 against the US Dollar. BCH could correct higher, but upsides are likely to be capped near $360 or $380.
Bitcoin Cash Price Analysis
Recently, there was a strong decline in bitcoin cash price after it broke the $385 and $380 supports against the US Dollar. The BCH/USD pair even broke the $350 support and settled well below the 55 simple moving average (4-hours). Moreover, the pair traded close to the $300 handle and a new monthly low was formed near $311 level. The price is currently correcting higher above the $325 level.
It broke the 23.6% Fib retracement level of the recent decline from the $428 high to $311 swing low. At the moment, the price is trading inside a short term channel with support near $335. On the upside, there is a decent resistance forming near $360. If there is an upside break above $360, the price may test $370. It coincides with the 50% Fib retracement level of the recent decline from the $428 high to $311 swing low.
The main resistance is near the $380 and $385 levels. Moreover, there is a major bearish trend line forming with resistance near $385 on the 4-hours chart of the BCH/USD pair. Therefore, if there is an upside correction, the price is likely to face a strong selling interest near the $370 or $380 level. A successful close above $385 and the 55 simple moving average (4-hours) is needed for more gains.
On the downside, an immediate support is near the $320 level. If there are more losses, the price could even break the $311 swing low in the near term. In the mentioned case, the price is likely to accelerate below the $300 handle.

Looking at the chart, bitcoin cash price is clearly in a strong bearish zone below the $470 and $480 resistance levels. In the short term, there might be an upside correction, but the bulls could struggle near $470.
Technical indicators
4 hours MACD – The MACD for BCH/USD is currently losing momentum in the bearish zone.
4 hours RSI (Relative Strength Index) – The RSI for BCH/USD is currently recovering towards the 40 level.
Key Support Levels – $320 and $300.
Key Resistance Levels – $370 and $385.


Leave a Reply
You must be logged in to post a comment.