- Bitcoin cash price is facing a strong resistance near the $308 level against the US Dollar.
- The price is currently trading above a couple of key supports near the $288 and $282 levels.
- There is a major bullish trend line forming with support near $286 on the 4-hours chart of the BCH/USD pair (data feed from Kraken).
- The pair could decline further if there is a break below $286 and $284.
Bitcoin cash price is correcting gains below the $300 level against the US Dollar. BCH/USD might extend its correction towards the $268 support area.
Bitcoin Cash Price Analysis
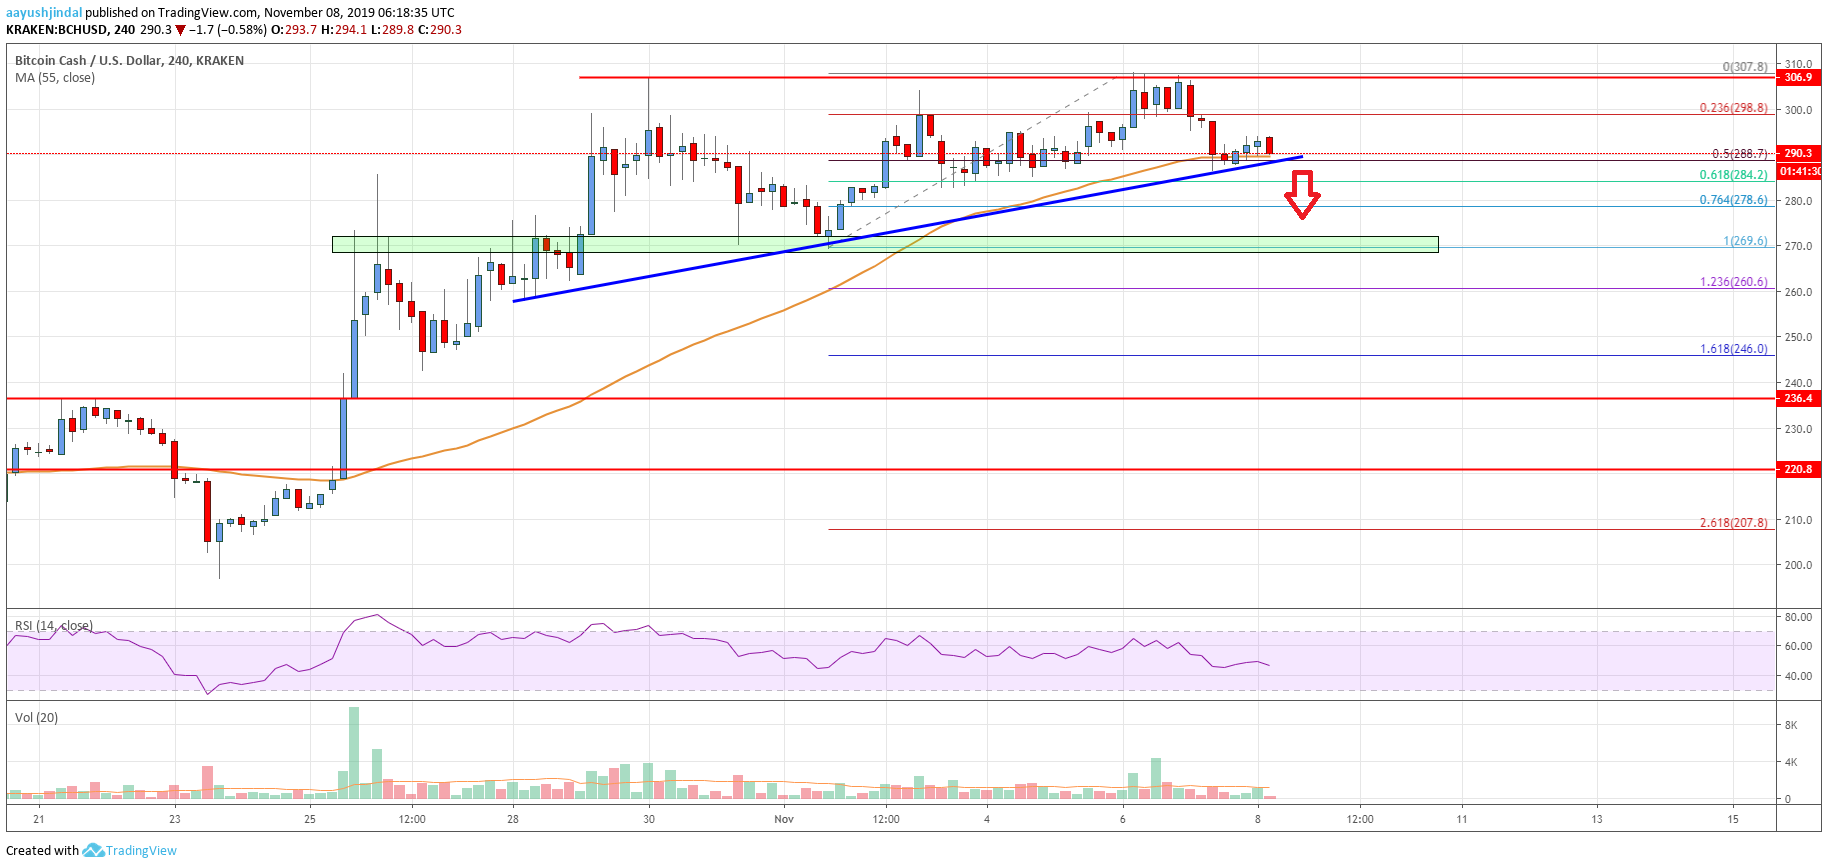
In the past few days, there was a steady increase in bitcoin cash price above the $268 and $284 resistance levels. Moreover, BCH price settled above the $280 level and the 55 simple moving average (4-hours).
Finally, the price traded above the key $300 resistance area. However, the price struggled to gain momentum above the $307 and $308 resistance levels. There were more than two attempts to surpass $308, but the bulls failed.
A swing high was formed near $308 and the price is currently correcting lower. It traded below the $300 level. Besides, there was a break below the 50% Fib retracement level of the recent wave from the $269 low to $307 high.
At the moment, the price is trading near the $286 support area and the 55 simple moving average (4-hours). Additionally, there is a major bullish trend line forming with support near $286 on the 4-hours chart of the BCH/USD pair.
The 61.8% Fib retracement level of the recent wave from the $269 low to $307 high is near the $284 level. Therefore, a downside break below the $286 and $284 support levels might start a downside extension.
The next key support area is near the $268 level, below which bitcoin cash price might continue to slide towards the $250 level.
On the upside, an initial resistance is near the $300 level. Having said that, the main resistance is near the $307 and $308 levels. A clear break above the $308 level could set the pace for a move towards the $320 and $330 levels.

Looking at the chart, bitcoin cash price is clearly trading near a crucial support at $286. If it fails to stay above $286 and $284, there could be an extended downside correction. Conversely, if may perhaps climb above the $308 resistance.
Technical indicators
4 hours MACD – The MACD for BCH/USD is currently losing momentum in the bullish zone.
4 hours RSI (Relative Strength Index) – The RSI for BCH/USD is currently just below the 50 level.
Key Support Levels – $284 and $268.
Key Resistance Levels – $300 and $308.


Leave a Reply
You must be logged in to post a comment.