- Bitcoin cash price started a fresh increase above the $650 resistance against the US Dollar.
- The price is now trading above the $650 zone and the 55 simple moving average (4-hours).
- There is a key bullish trend line forming with support near $660 on the 4-hours chart of the BCH/USD pair (data feed from Coinbase).
- The pair could continue to rise if it clears the $680 and $690 resistance levels.
Bitcoin cash price is moving higher above $650 against the US Dollar, similar to bitcoin. BCH/USD must stay climb above $680 to continue higher in the near term.
Bitcoin Cash Price Analysis
After forming a base above the $600 level, bitcoin cash price started a fresh increase. BCH broke many hurdles near the $660 level to move into a positive zone.
The price even broke the $680 resistance and the 55 simple moving average (4-hours). However, the price failed to gain pace above the $6900 level. A high was formed near $693 and recently it started a fresh decline. There was a clear break below the $680 and $650 support levels.
The price traded as low as $624 before it recovered losses. The price is back above the $650 level and the 55 simple moving average (4-hours). There was a break above the 50% Fib retracement level of the downward move from the $693 swing high to $634 low.
It is now consolidating below the $680 resistance zone. The next major resistance could be $690. The main breakout zone is near the $700 level. A clear break above $690 and $700 might trigger a sharp upward move.
On the downside, an initial support is near the $660 level. There is also a key bullish trend line forming with support near $660 on the 4-hours chart of the BCH/USD pair. A downside break below the $650 support zone could open the doors for a larger decline. The next major support is near the $620 level, below which the bears might aim a test of $600.
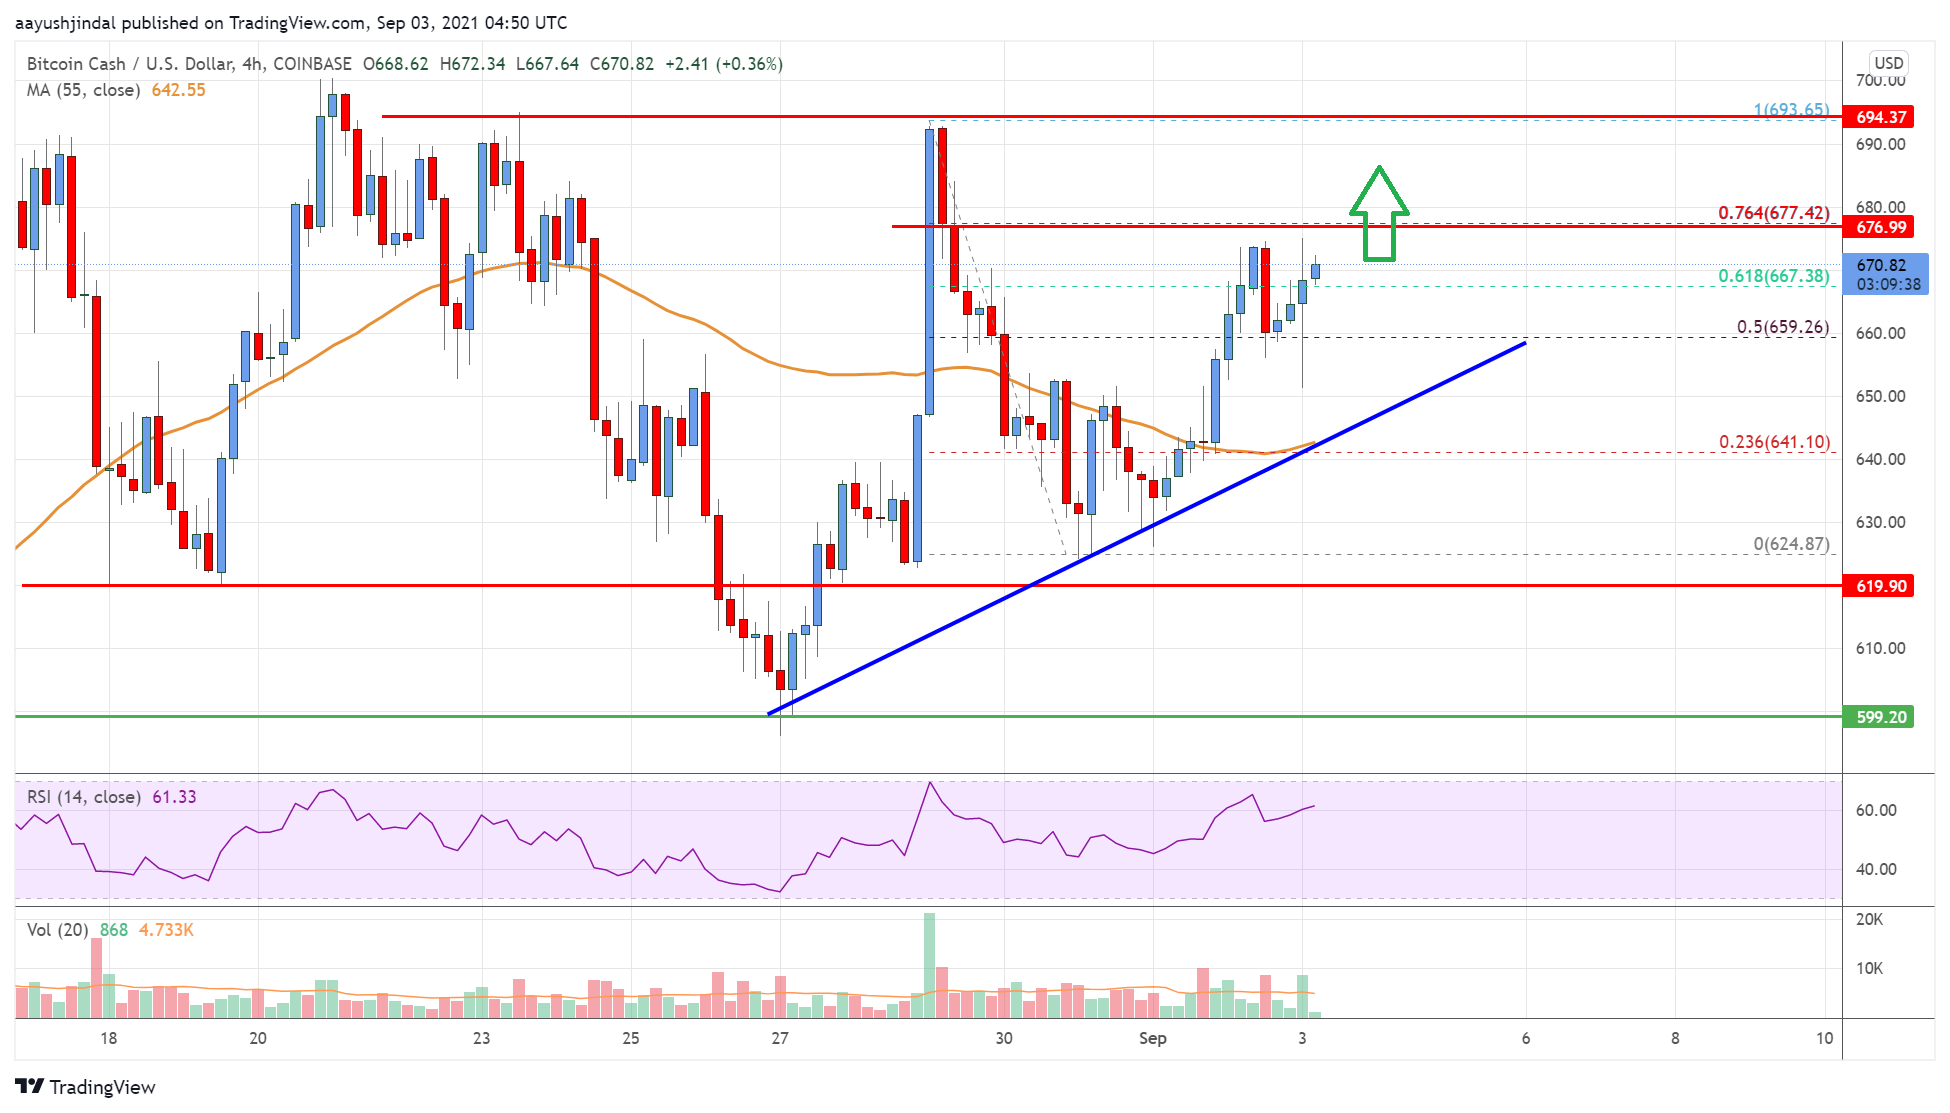
Looking at the chart, bitcoin cash price is now trading above the $650 zone and the 55 simple moving average (4-hours). Overall, the price could continue to rise if it clears the $680 and $690 resistance levels.
Technical indicators
4 hours MACD – The MACD for BCH/USD is now gaining pace in the bullish zone.
4 hours RSI (Relative Strength Index) – The RSI for BCH/USD is above the 50 level.
Key Support Levels – $660 and $650.
Key Resistance Levels – $680 and $690.
