- Bitcoin cash price started a fresh increase from the $206 weekly low against the US Dollar.
- The price is up more than 10% and it broke the key $230 resistance area.
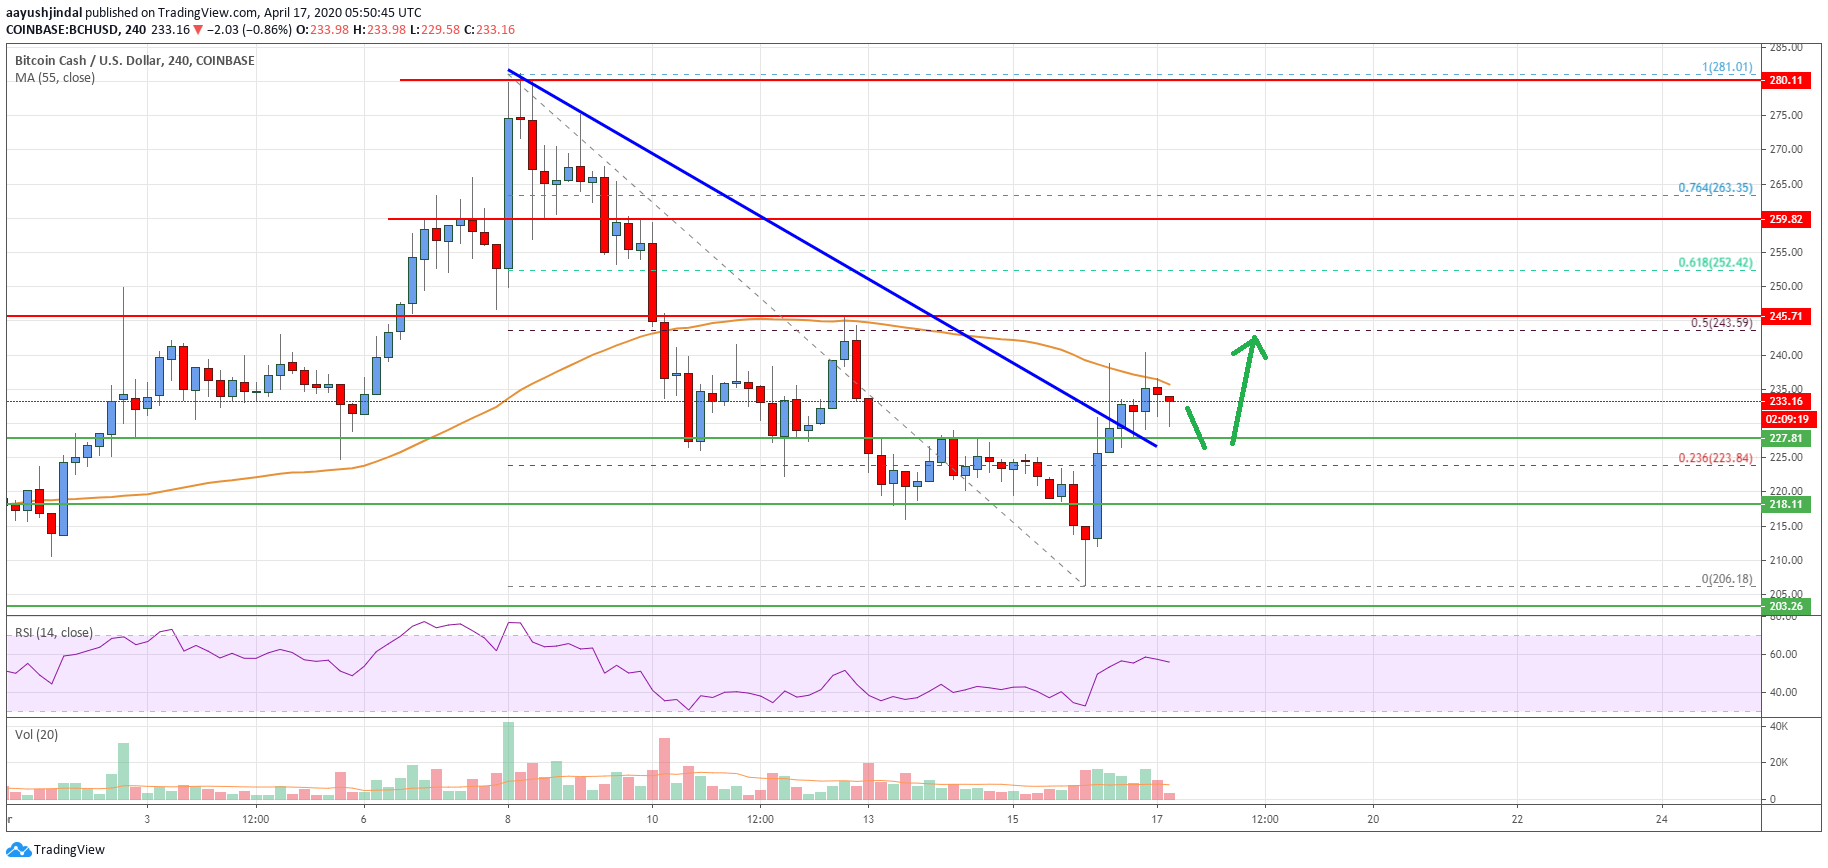
- There was a break above a major bearish trend line with resistance near $230 on the 4-hours chart of the BCH/USD pair (data feed from Coinbase).
- The pair is likely to continue higher towards the $245 and $250 resistance levels.
Bitcoin cash price is showing a few bullish signs above $230 against the US Dollar. BCH/USD bulls seem to be aiming more upsides towards $250 or $265 in the near term.
Bitcoin Cash Price Analysis
Earlier this week, there was a downside extension in bitcoin cash price below the $218 support against the US Dollar. BCH price even broke the $210 support level and settled well below the 55 simple moving average (4-hours).
It traded to a new weekly low at $206 and it is currently correcting higher. There was a break above the $220 level. The price is up more than 10% and it broke the key $230 resistance area.
It even surpassed the 23.6% Fib retracement level of the last key decline from the $281 high to $206 low. Moreover, there was a break above a major bearish trend line with resistance near $230 on the 4-hours chart of the BCH/USD pair.
The pair is now consolidating gains above the $230 level and it is struggling to clear the 55 simple moving average (4-hours). The first key resistance is near the $245 level. It is close to the 50% Fib retracement level of the last key decline from the $281 high to $206 low.
The main resistance is near the $250 level, above which the price is likely to gain bullish momentum. In the mentioned case, the next stop for the bulls might be $265.
On the downside, an initial support is near the $228 zone. The main support is near the $218 level (the recent breakout zone). If the price fails to stay above the $218 support, there is a risk of a sharp decline towards $206 or $200.

Looking at the chart, bitcoin cash price is clearly showing a few bullish signs above the $228 level. However, the bulls need to gain momentum above $245 and $250 for more upsides in the near term.
Technical indicators
4 hours MACD – The MACD for BCH/USD is currently gaining momentum in the bullish zone.
4 hours RSI (Relative Strength Index) – The RSI for BCH/USD is now well above the 50 level.
Key Support Levels – $228 and $218.
Key Resistance Levels – $250 and $265.


Leave a Reply
You must be logged in to post a comment.