- Bitcoin cash price started a fresh decline after it topped near the $280 level against the US Dollar.
- The price is down more than 5% and it broke the key $250 support area.
- There was a break below a connecting bullish trend line with support near $246 on the 4-hours chart of the BCH/USD pair (data feed from Coinbase).
- The pair is likely to continue lower and it could even retest the $225 support area.
Bitcoin cash price is showing a few bearish signs below $250 against the US Dollar. BCH/USD bears seem to be aiming more losses towards $225 or $220 in the near term.
Bitcoin Cash Price Analysis
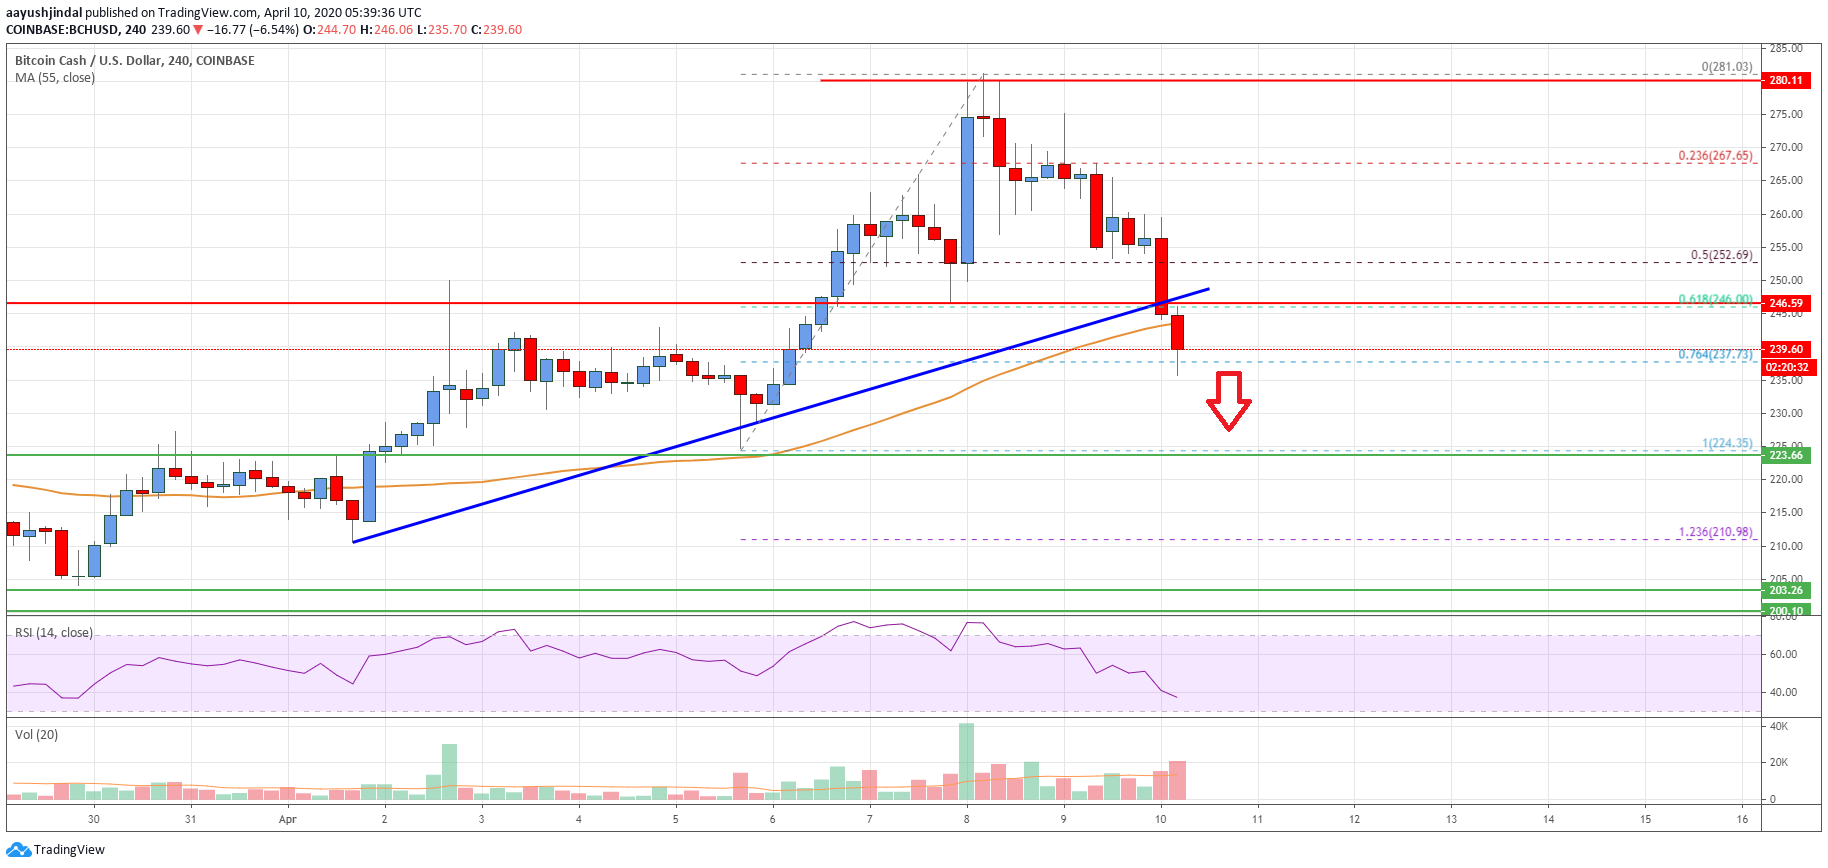
Earlier this week, there was a sharp rise in bitcoin cash price above the $250 resistance against the US Dollar. BCH price even settled above the $260 resistance and the 55 simple moving average (4-hours).
Finally, the price climbed above the $275 level, but it faced a strong resistance near the $280 zone. The price traded as high as $281 and recently started a fresh bearish wave.
There was a break below the $250 support level and the 55 simple moving average (4-hours). Moreover, there was a break below a connecting bullish trend line with support near $246 on the 4-hours chart of the BCH/USD pair.
The pair even declined below the 50% Fib retracement level of the key upward move from the $224 low $281 high. On the downside, an initial support is near the $235 level.
The 76.4% Fib retracement level of the key upward move from the $224 low $281 high is also acting as a support. If the price fails to stay above the $235 support, there are chances of more losses towards the key $225 support area in the near term.
Any further losses may perhaps clear the path for more losses in the near term towards the $220 and $205 levels. On the upside, the previous support near $250 and the 55 simple moving average (4-hours) could act as a hurdle for the bulls. A clear break above $250 is needed for a fresh increase.
Looking at the chart, bitcoin cash price is clearly showing a few bearish signs below the $250 level. Therefore, there are high chances of more downsides towards $225 and $220.
Technical indicators
4 hours MACD – The MACD for BCH/USD is currently gaining momentum in the bearish zone.
4 hours RSI (Relative Strength Index) – The RSI for BCH/USD is now well below the 50 level.
Key Support Levels – $225 and $205.
Key Resistance Levels – $250 and $265.