- Bitcoin cash price is currently recovering above the $200 resistance zone against the US Dollar.
- The price is showing positive signs above the $210 and $215 levels.
- There is a key bullish trend line forming with support near $224 on the 4-hours chart of the BCH/USD pair (data feed from Coinbase).
- The pair is likely to surge higher if it clears the $240 and $244 resistance levels.
Bitcoin cash price is trading in a positive zone above $200 against the US Dollar. BCH/USD is likely setting up for a strong rise above the $240 resistance area in the near term.
Bitcoin Cash Price Analysis
In the past few days, there was a decent recovery wave in bitcoin cash price above the $200 resistance against the US Dollar. BCH price even settled above the $205 pivot level and 55 simple moving average (4-hours) to enter a positive zone.
Besides, there was a close above the 23.6% Fib retracement level of the key drop from the $352 swing high to $132 swing low. The price is now trading above the $220 zone, but it seems to be facing a strong resistance near the $240 level.
The bears also protected the 50% Fib retracement level of the key drop from the $352 swing high to $132 swing low. The price is currently trading in a range above the $220 support and the 55 simple moving average (4-hours).
More importantly, there is a key bullish trend line forming with support near $224 on the 4-hours chart of the BCH/USD pair. If there is a downside break below the trend line support, the price could decline towards the $200 support.
The next major support is near the $185 level, below which the bears are likely to aim a test of the $165 support area in the near term.
On the upside, the main hurdles are near the $240 and $245 levels. A successful close above the $245 level and a follow through above the $250 resistance is likely to accelerate gains in the coming sessions.
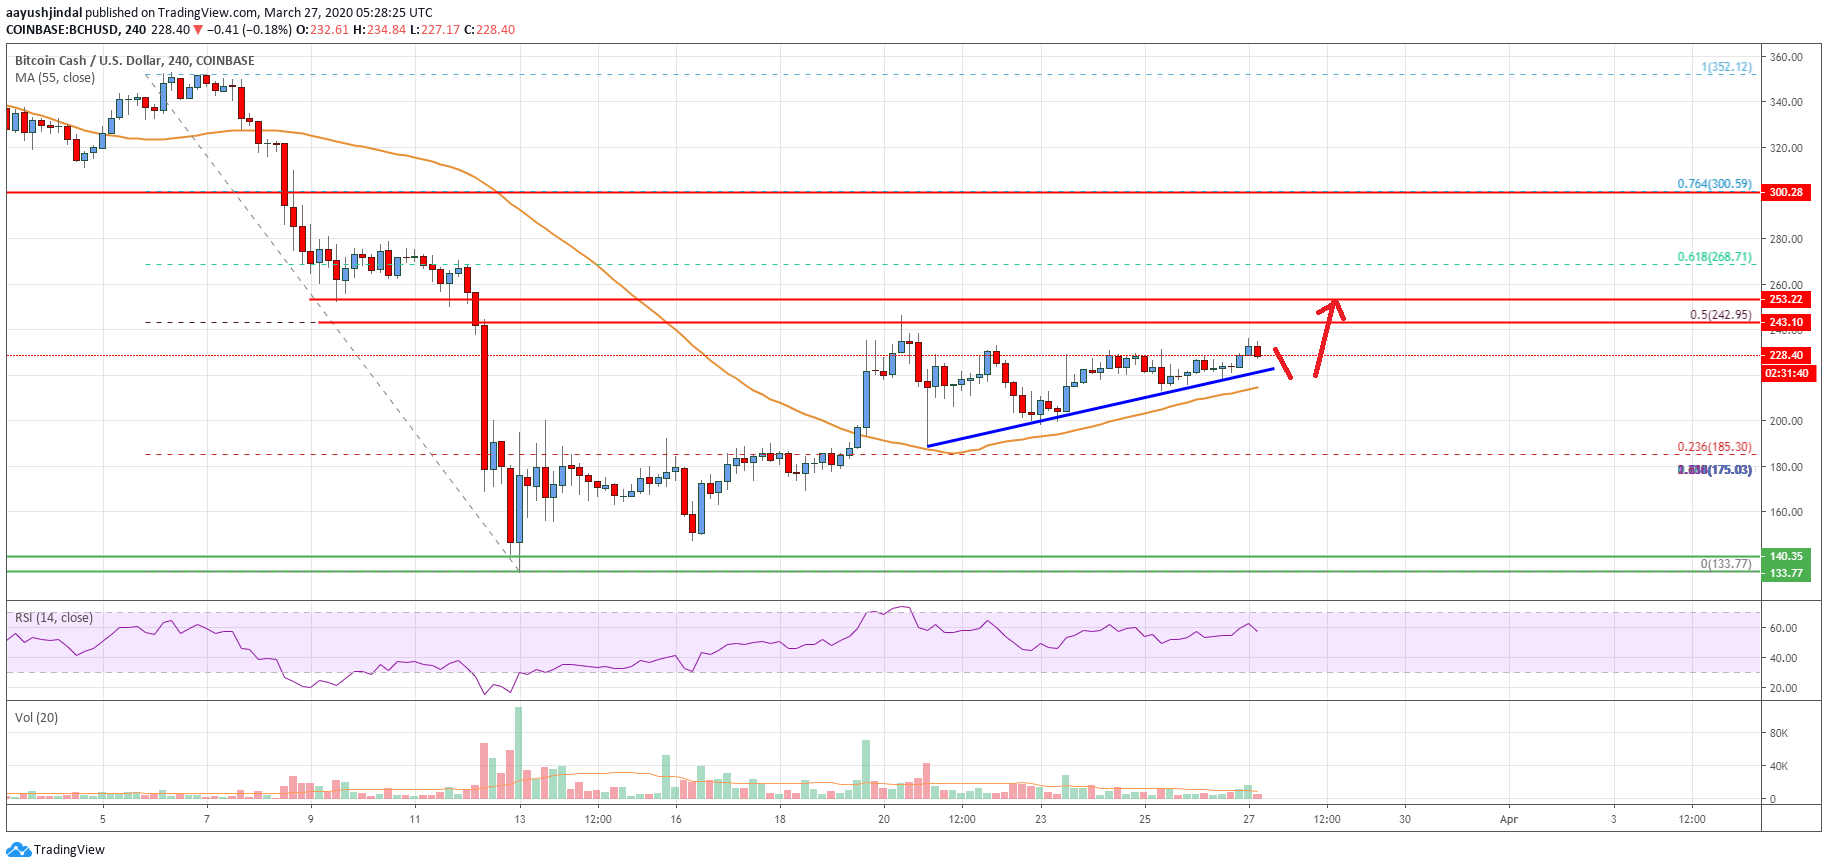
Looking at the chart, bitcoin cash price is trading in a range below the key $244 resistance area. If the bulls fail to push the price above the $244 resistance, there could be a sharp decline in the near term.
Technical indicators
4 hours MACD – The MACD for BCH/USD is currently losing momentum in the bullish zone.
4 hours RSI (Relative Strength Index) – The RSI for BCH/USD is correcting lower from the 60 level.
Key Support Levels – $220 and $200.
Key Resistance Levels – $245 and $250.