- Bitcoin cash price is currently correcting higher from the $133 yearly low against the US Dollar.
- The price is up more than 20% and it is now trading above the $200 level.
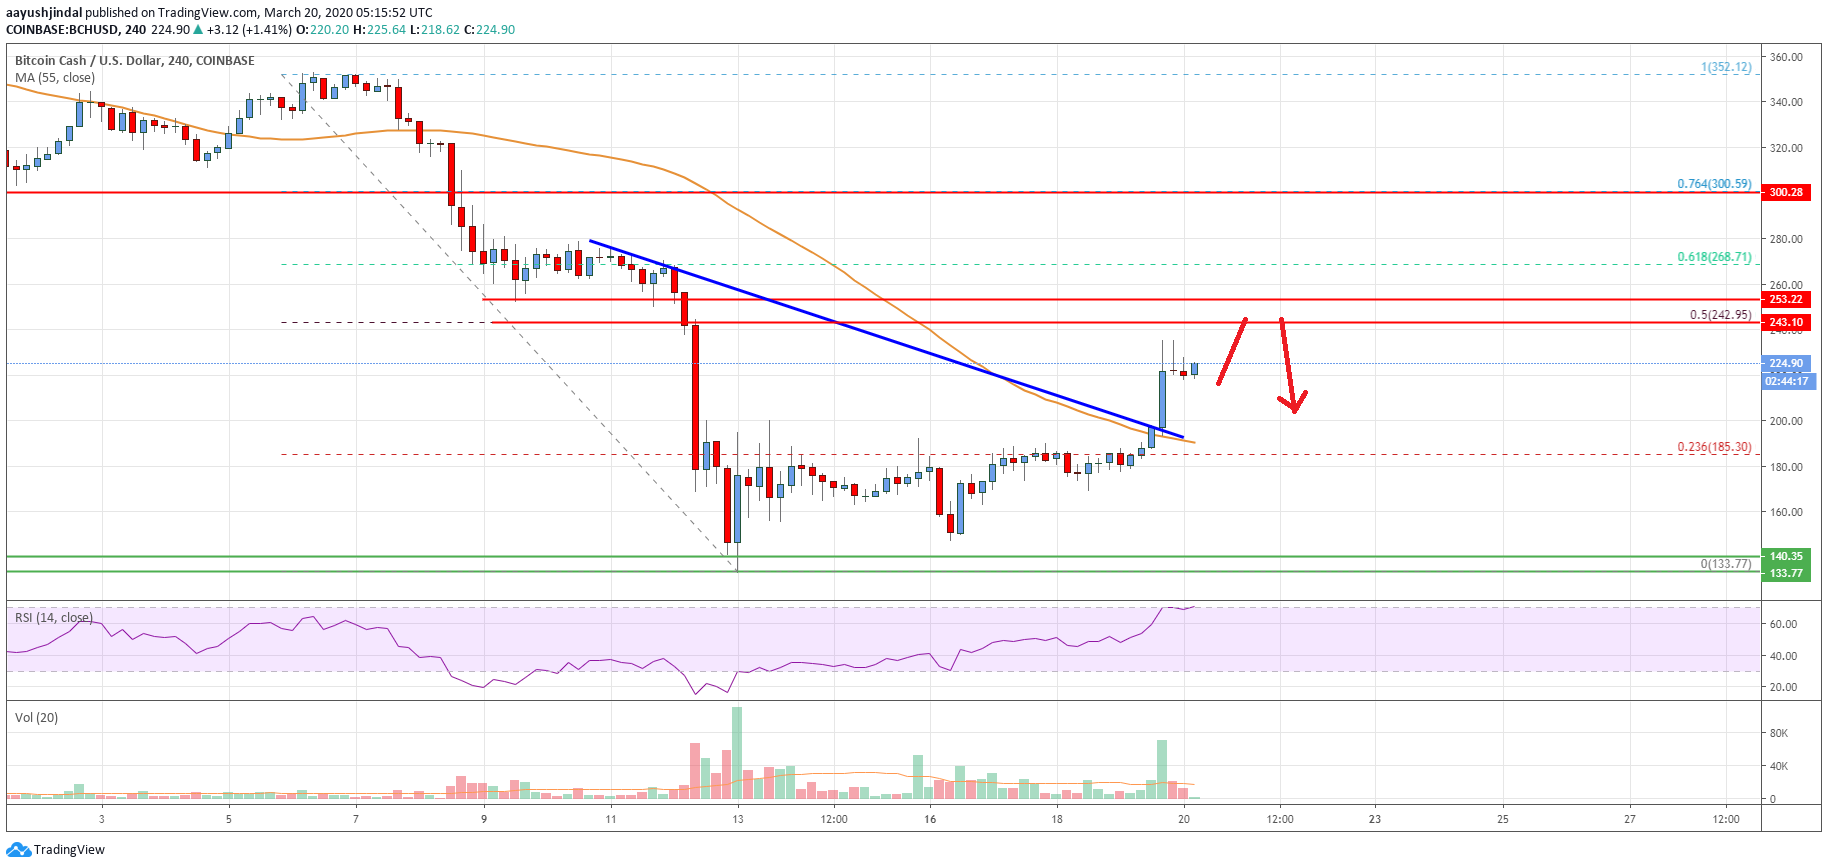
- There was a break above a key bearish trend line with resistance near $195 on the 4-hours chart of the BCH/USD pair (data feed from Coinbase).
- The pair is now approaching a major resistance area near the $240 and $242 levels.
Bitcoin cash price is showing a few positive signs above $200 against the US Dollar. However, BCH/USD is likely to face a strong selling interest near the $240 resistance zone.
Bitcoin Cash Price Analysis
This past week, we saw a major decline in bitcoin cash price below the $200 support against the US Dollar. BCH price even broke the $150 support and the 55 simple moving average (4-hours) to enter a bearish zone.
It traded to a new yearly low at $133 and recently started an upside correction. The price climbed above the $160 and $180 resistance levels. Besides, there was a break above the 23.6% Fib retracement level of the main decline from the $352 swing high to $133 low.
There was also a break above a key bearish trend line with resistance near $195 on the 4-hours chart of the BCH/USD pair. The pair is now trading above the $200 resistance and the 55 simple moving average (4-hours).
On the upside, there is a major hurdle waiting near the $240 and $250 levels. The 50% Fib retracement level of the main decline from the $352 swing high to $133 low is also near the $242 level to act as a key resistance.
Therefore, a successful close above the $240 and $250 resistance levels won’t be easy in the near term. The next hurdle is seen near the $300 level.
Conversely, the price could fail to recover above the $240 and $242 resistance levels. In the mentioned case, there is a risk of a fresh decrease below the $210 and $200 support levels. Besides, if the price fails to stay above the 55 simple moving average (4-hours), there is a risk of a drop towards $150.
Looking at the chart, bitcoin cash price is showing a few recovery signs above $200 and $200. Having said that, the bulls need to overcome the $250 resistance for more gains.
Technical indicators
4 hours MACD – The MACD for BCH/USD is currently gaining momentum in the bullish zone.
4 hours RSI (Relative Strength Index) – The RSI for BCH/USD is now well above the 60 level.
Key Support Levels – $200 and $185.
Key Resistance Levels – $240 and $250.
