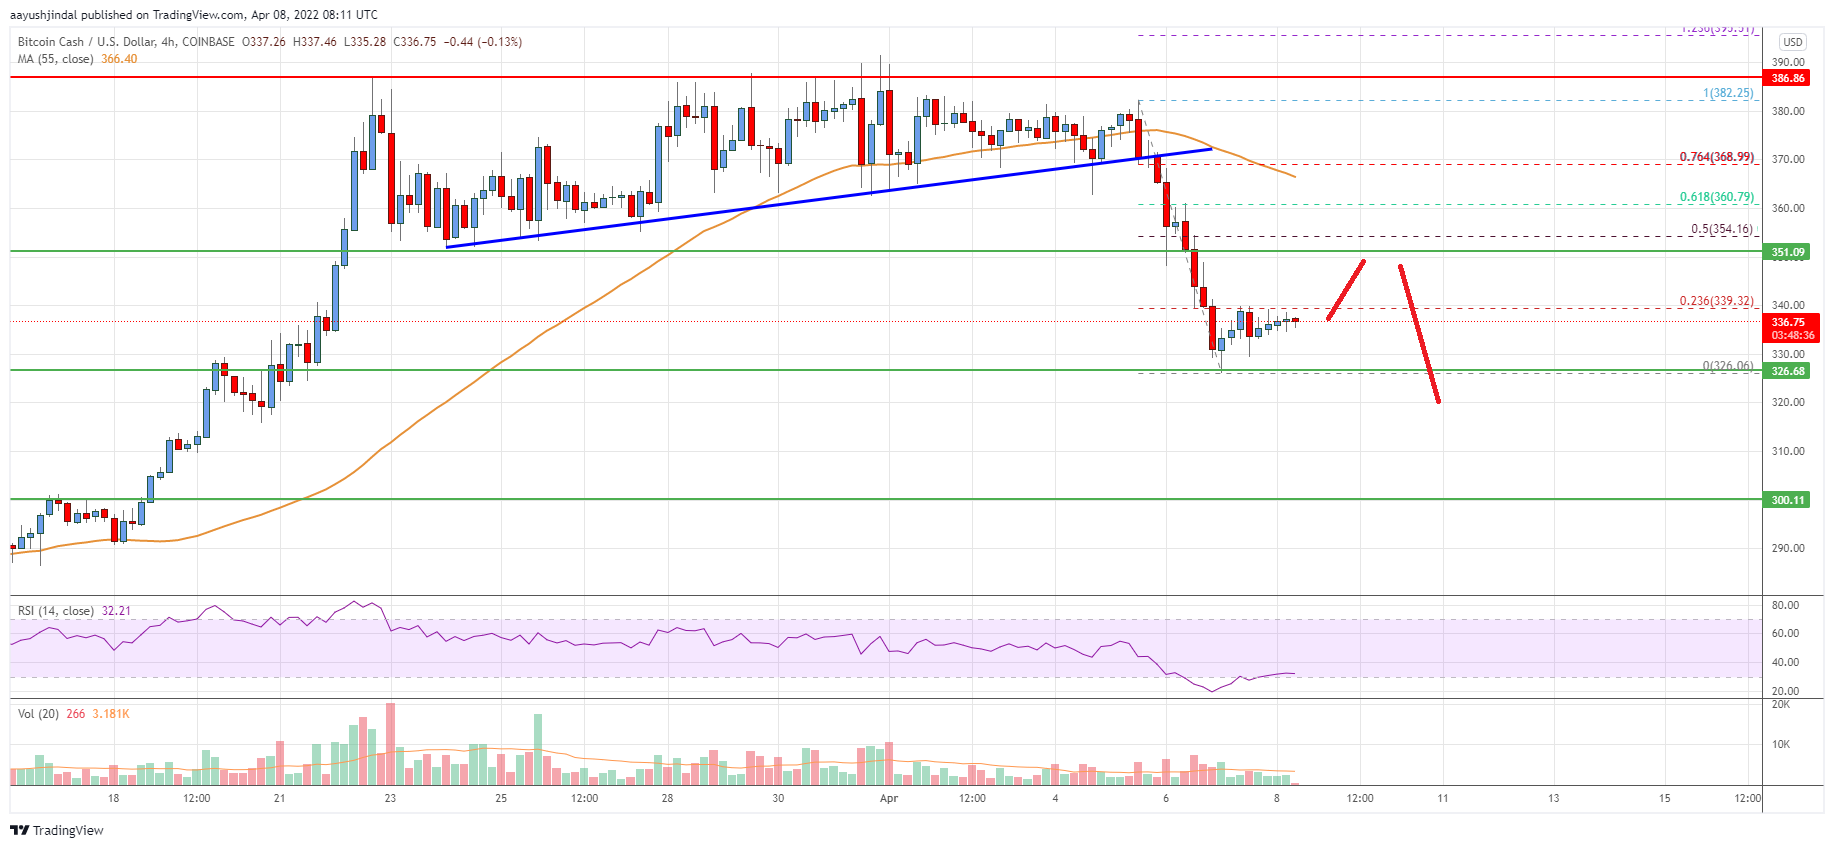
- Bitcoin cash price started a fresh decline from the $385 resistance against the US Dollar.
- The price is now trading below the $350 zone and the 55 simple moving average (4-hours).
- There was a break below a major bullish trend line with support near $370 on the 4-hours chart of the BCH/USD pair (data feed from Coinbase).
- The pair remains at a risk of a downside break below the $325 support zone in the near term.
Bitcoin cash price is struggling below $350 against the US Dollar, similar to bitcoin. BCH/USD could extend losses if there is a clear move below $325.
Bitcoin Cash Price Analysis
Bitcoin cash price made a few attempts to gain strength above $386 and $390. However, BCH failed to gain pace and started a fresh decline below the $380 level.
There was a move below the $370 level and the 55 simple moving average (4-hours). Besides, there was a break below a major bullish trend line with support near $370 on the 4-hours chart of the BCH/USD pair. The pair even broke the $350 support zone.
A low is formed near $326 and is currently consolidating losses. On the upside, the price is now facing resistance near the $340 level. It is near the 23.6% Fib retracement level of the downward move from the $382 swing high to $326 low.
The next major resistance is near the $350 level. The 50% Fib retracement level of the downward move from the $382 swing high to $326 low is also near the $355 level.
A clear break above $350 and $355 might start a fresh increase. In the stated case, the price could even clear the $370 resistance zone. The next major hurdle is near the $386 level.
If not, the pair might resume its decline below the $330 level. The next major support is near the $325 level, below which the bears gain strength. The next target for them may perhaps be near the $300 level.

Looking at the chart, bitcoin cash price is now trading below the $360 zone and the 55 simple moving average (4-hours). Overall, the price remains at a risk of a downside break below the $325 support zone in the near term.
Technical indicators
4 hours MACD – The MACD for BCH/USD is slowly losing pace in the bearish zone.
4 hours RSI (Relative Strength Index) – The RSI for BCH/USD is now below the 50 level.
Key Support Levels – $325 and $300.
Key Resistance Levels – $350 and $355.


Leave a Reply
You must be logged in to post a comment.