
- Bitcoin cash price started a fresh decline from the $250 zone against the US Dollar.
- The price is now trading below the $240 zone and the 55 simple moving average (4 hours).
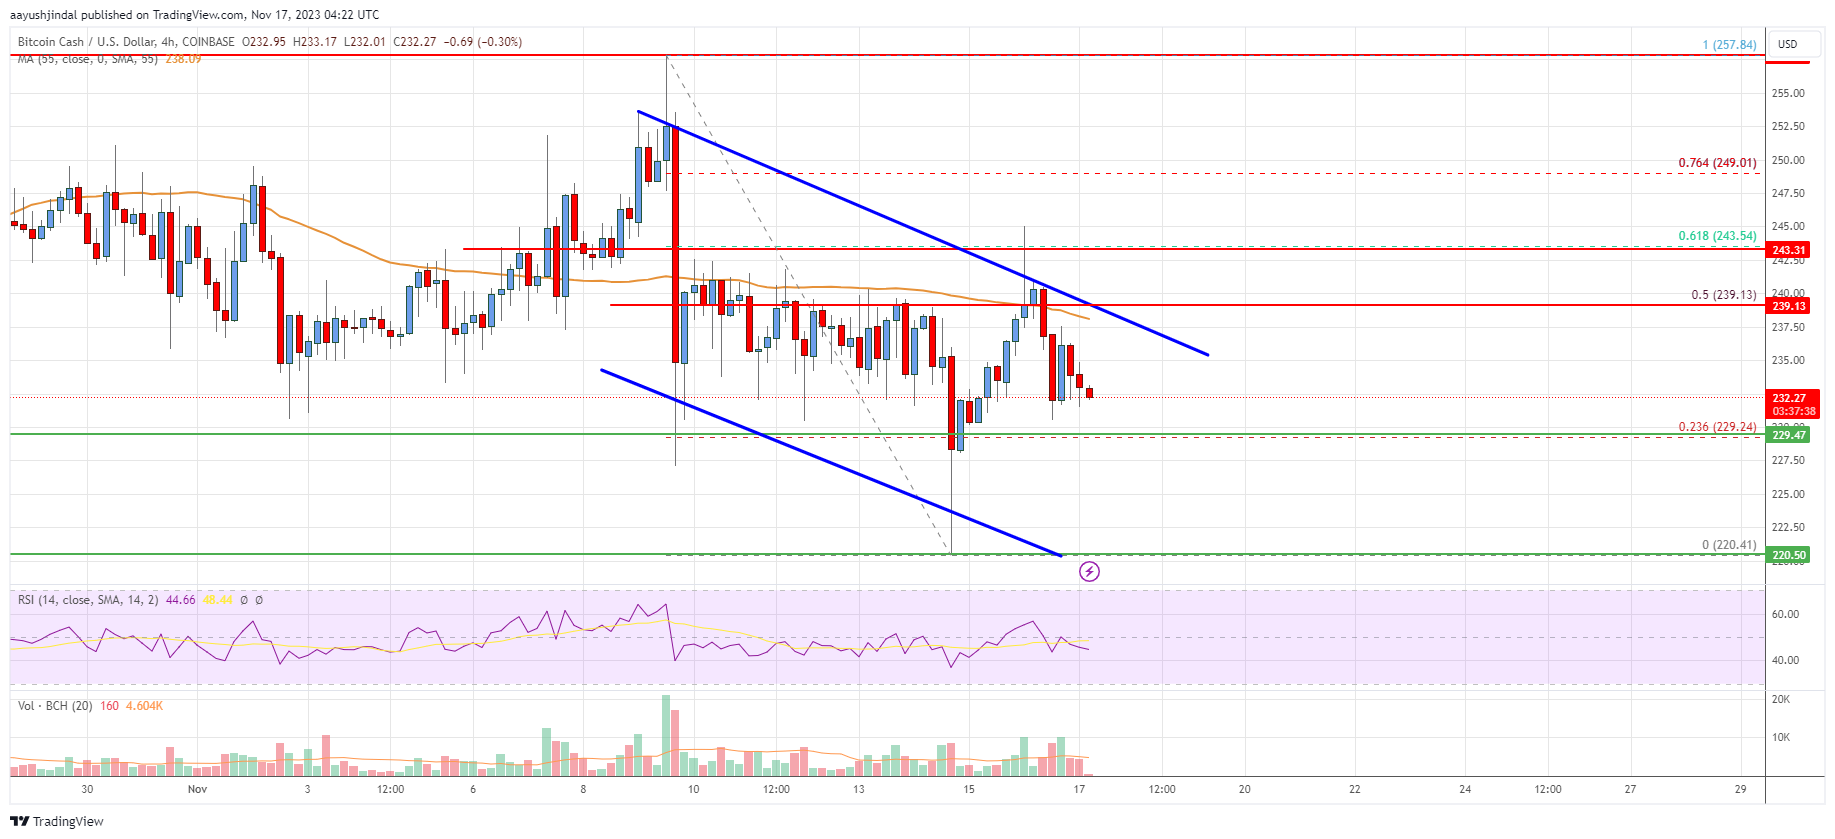
- There is a key declining channel forming with resistance near $238 on the 4-hour chart of the BCH/USD pair (data feed from Coinbase).
- The pair could start a fresh decline if it stays below the $242 resistance zone.
Bitcoin cash price is struggling below the $240 zone against the US Dollar, like Bitcoin. BCH/USD could restart its decline if it fails near $240 or $242.
Bitcoin Cash Price Analysis
Bitcoin cash price struggled to continue higher above the $250 resistance zone. BCH formed a short-term top near $243 before it started a fresh decline. There was a drop below the $242 and $240 support levels.
It even declined below the $230 support level. The price tested the $220 support. A low is formed near the $220.41 level and the price is now correcting losses. It climbed a few points higher above the $230 level. However, BCH is now trading below the $240 zone and the 55 simple moving average (4 hours).
There is also a key declining channel forming with resistance near $238 on the 4-hour chart of the BCH/USD pair. Immediate resistance is near the channel resistance or $240 or the 50% Fib retracement level of the downward move from the $257.84 swing high to the $220.41 low.
The next key resistance is near the $242 zone. It is close to the 61.8% Fib retracement level of the downward move from the $257.84 swing high to the $220.41 low. Any more gains above $242 could set the pace for a move toward the $250 level.
If there is a move above the $250 resistance, the price could rise toward the $258 zone. If not, the price might continue lower below $230. Immediate support on the downside is near the $225 zone. The next major support is near the $220 level, below which the bears might aim for $212 or even $208.
Looking at the chart, Bitcoin cash price is now trading below the $240 zone and the 55 simple moving average (4 hours). Overall, the price could start a fresh decline if it stays below the $242 resistance zone.
Technical indicators
4 hours MACD – The MACD for BCH/USD is gaining pace in the bearish zone.
4 hours RSI (Relative Strength Index) – The RSI for BCH/USD is below the 50 level.
Key Support Levels – $230 and $220.
Key Resistance Levels – $240 and $242.


