
- Bitcoin cash price started a fresh decline after it failed near the $280 resistance against the US Dollar.
- The price declined below the key $250 and $245 support levels.
- There is a key ascending channel forming with support near $235 on the 4-hours chart of the BCH/USD pair (data feed from Coinbase).
- The pair could either break the $245 resistance to continue higher or decline further towards $215.
Bitcoin cash price is correcting losses from the $217 low against the US Dollar. BCH/USD must stay above the $230 support to start a fresh increase above $250.
Bitcoin Cash Price Analysis
This past week, bitcoin cash price struggled to continue above the $275 and $280 resistance levels against the US Dollar. As a result, BCH started a strong decline and broke the $260 and $250 support levels.
Besides, there was a close below the $245 level and the 55 simple moving average (4-hours). The price traded as low as $217 and it is now back above the $225 pivot level.
There was a break above the 23.6% Fib retracement level of the key decline from the $277 high to $217 low. However, bitcoin cash price is currently facing a strong resistance near the $245 level and the 55 simple moving average (4-hours).
The 50% Fib retracement level of the key decline from the $277 high to $217 low is also near the $248 level. It seems like there is a key ascending channel forming with support near $235 on the 4-hours chart of the BCH/USD pair.
The channel resistance is near the $248 resistance. Therefore, the price must climb above the $245 and $250 resistance levels to continue higher. A successful close above the $250 resistance might start a decent increase towards the $265 and $270 level.
On the downside, the channel support and $230 holds the key. If there is a downside break below the $230 support, the price may even struggle to stay above the $225 pivot. The next key support is near $216, below which the bears are likely to aim a test of the $202 support zone.
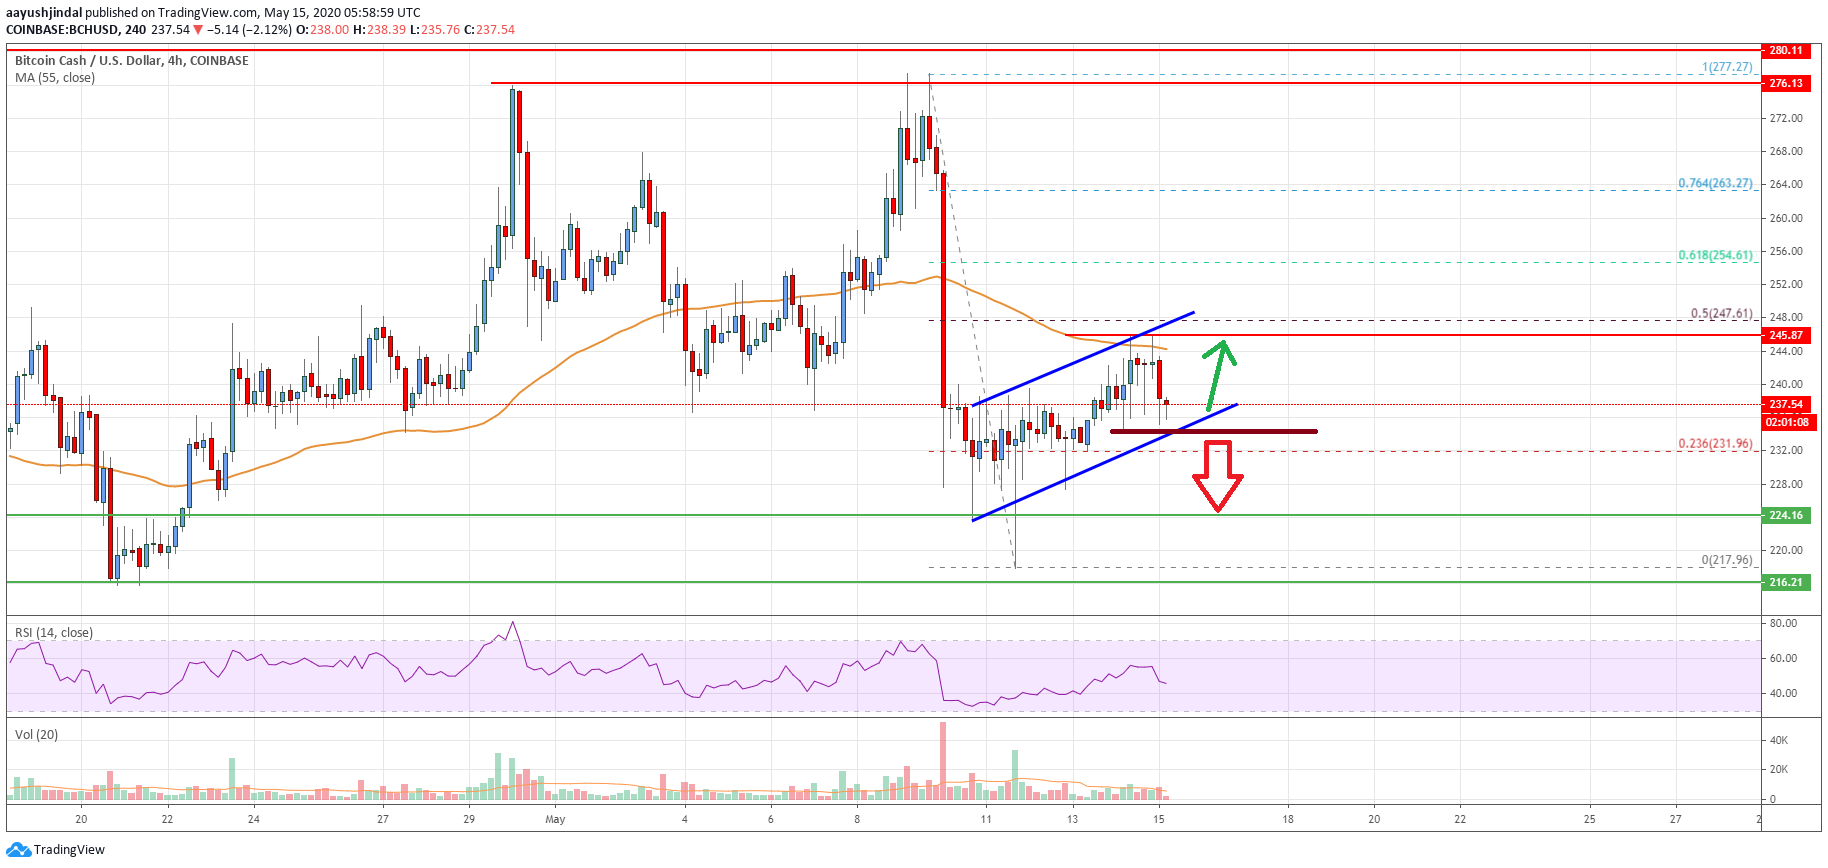
Looking at the chart, bitcoin cash price is clearly approaching a major resistance zone near the $245 and $250 levels. If the bulls fail to push the price above $250, there could be a sharp bearish wave towards $216 or $202.
Technical indicators
4 hours MACD – The MACD for BCH/USD is currently losing momentum in the bullish zone.
4 hours RSI (Relative Strength Index) – The RSI for BCH/USD is moving down towards the 40 level.
Key Support Levels – $230 and $216.
Key Resistance Levels – $245 and $250.


Leave a Reply
You must be logged in to post a comment.