
- Bitcoin cash price started a fresh decline from the $380 resistance against the US Dollar.
- The price is now trading below the $300 zone and the 55 simple moving average (4-hours).
- There is a key rising channel forming with support near $270 on the 4-hours chart of the BCH/USD pair (data feed from Coinbase).
- The pair could continue to move down if there is a break below the $250 support zone.
Bitcoin cash price is showing bearish signs below $300 against the US Dollar, similar to bitcoin. BCH/USD could extend losses unless there is a move above $300.
Bitcoin Cash Price Analysis
Bitcoin cash price started a major decline from the $380 resistance zone. BCH price declined below the $350 support and the 55 simple moving average (4-hours).
The price accelerated lower and even settled below the $300 level. Finally, there was a spike below the $265 level. A low is formed near $259, and the price is now consolidating losses. An immediate hurdle on the upside is near the $295 level.
It is near the 23.6% Fib retracement level of the downward move from the $400 swing high to $259 low. The next major resistance is near the $300 level and the 55 simple moving average (4-hours).
A clear break above $300 and $305 might spark a fresh increase. The main resistance is now forming near the $330 level. It is near the 50% Fib retracement level of the downward move from the $400 swing high to $259 low. If there is no upside break, the price could decline below $285.
There is also a key rising channel forming with support near $270 on the 4-hours chart of the BCH/USD pair. A downside break below the $370 and $365 support levels might start a major decline.
The next major support is near the $250 level, below which the bears might aim a test of $220. Any more downsides might lead the price towards the $200 level.
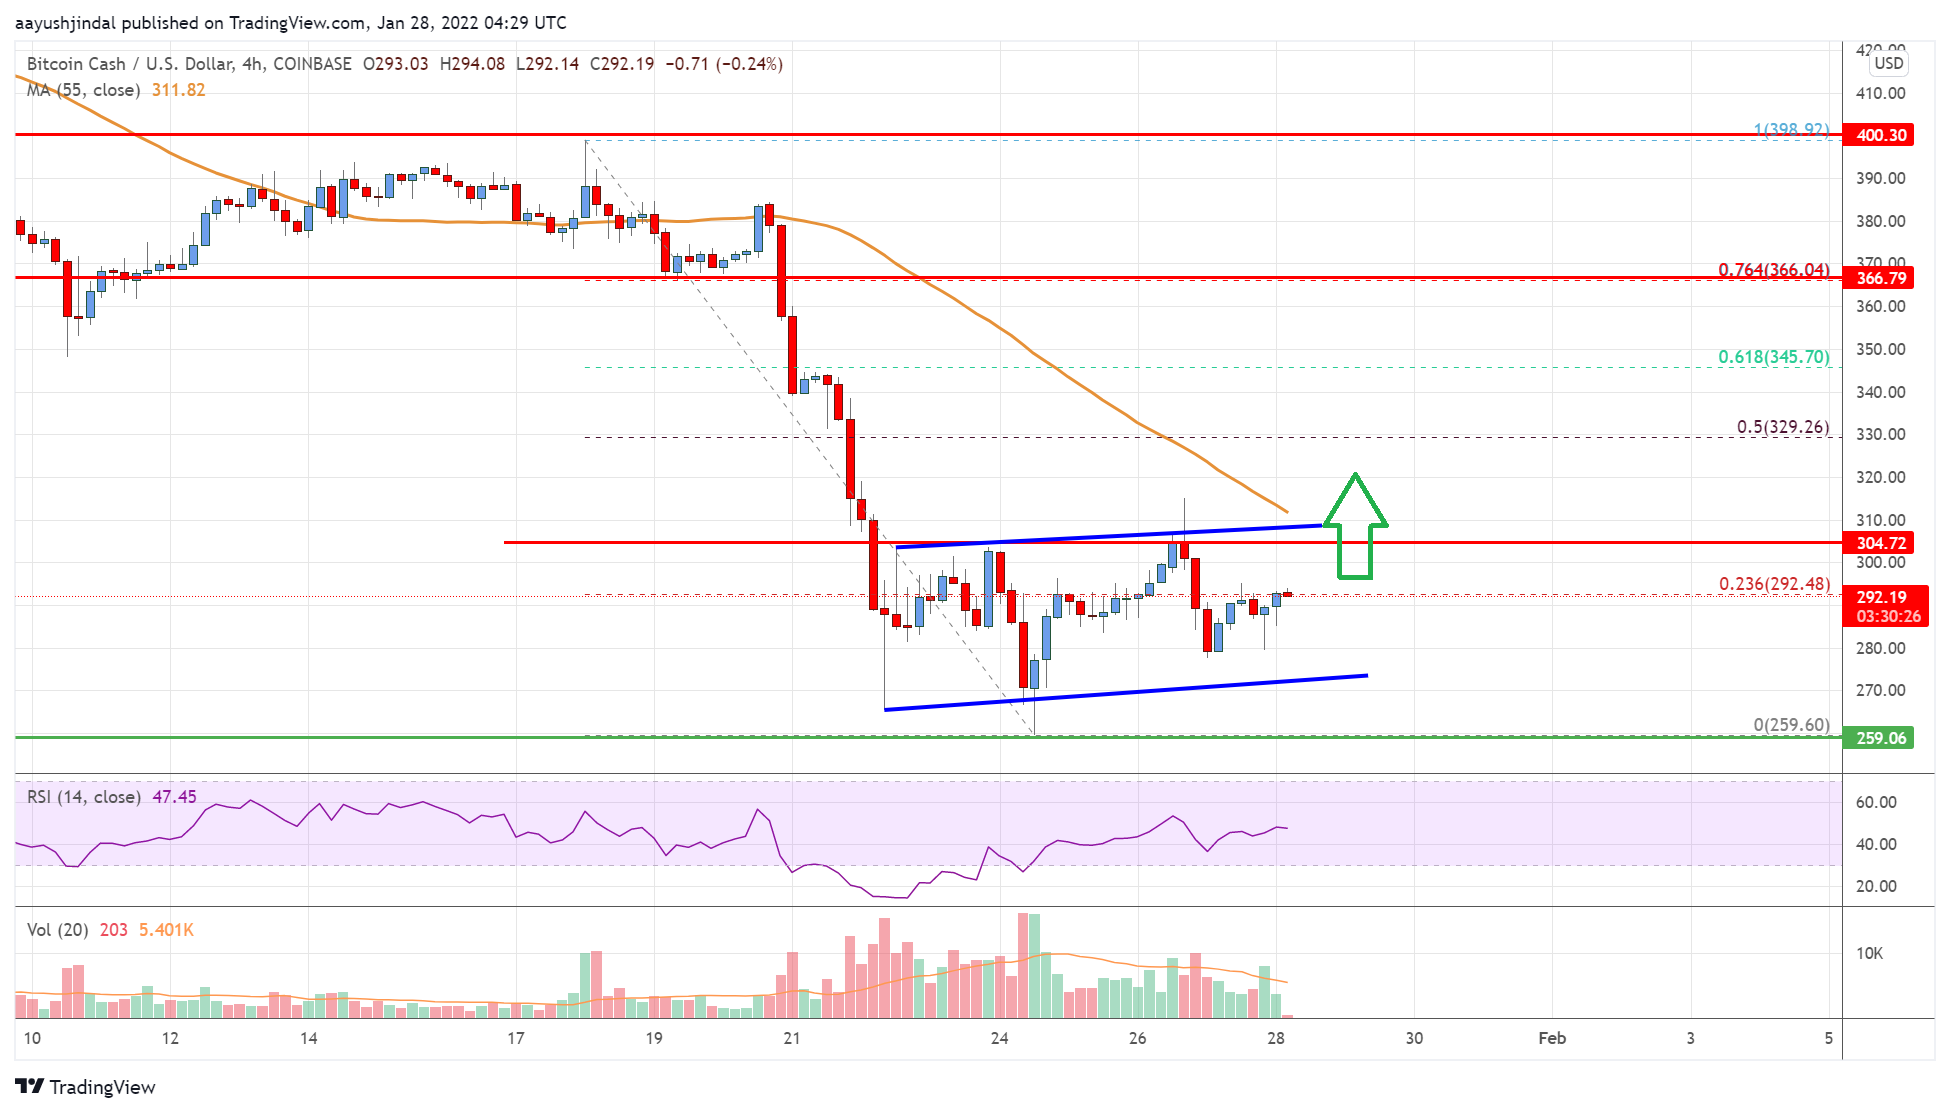
Looking at the chart, bitcoin cash price is now trading below the $300 zone and the 55 simple moving average (4-hours). Overall, the price could continue to move down if there is a break below the $250 support zone.
Technical indicators
4 hours MACD – The MACD for BCH/USD is slowly losing pace in the bearish zone.
4 hours RSI (Relative Strength Index) – The RSI for BCH/USD is now below the 50 level.
Key Support Levels – $265 and $250.
Key Resistance Levels – $300 and $330.


Leave a Reply
You must be logged in to post a comment.