
- Bitcoin price started a fresh decline from the $44,500 zone against the US Dollar.
- The price is now trading below $43,000 and the 55 simple moving average (4-hours).
- There is a key bearish trend line forming with resistance near $42,600 on the 4-hours chart of the BTC/USD pair (data feed from Coinbase).
- The pair could start a strong upward move if there was a break above the $43,000 resistance.
Bitcoin price is trading below $44,000 against the US Dollar. BTC might continue to decline as long as it is below the $43,000 resistance level.
Bitcoin Price Analysis
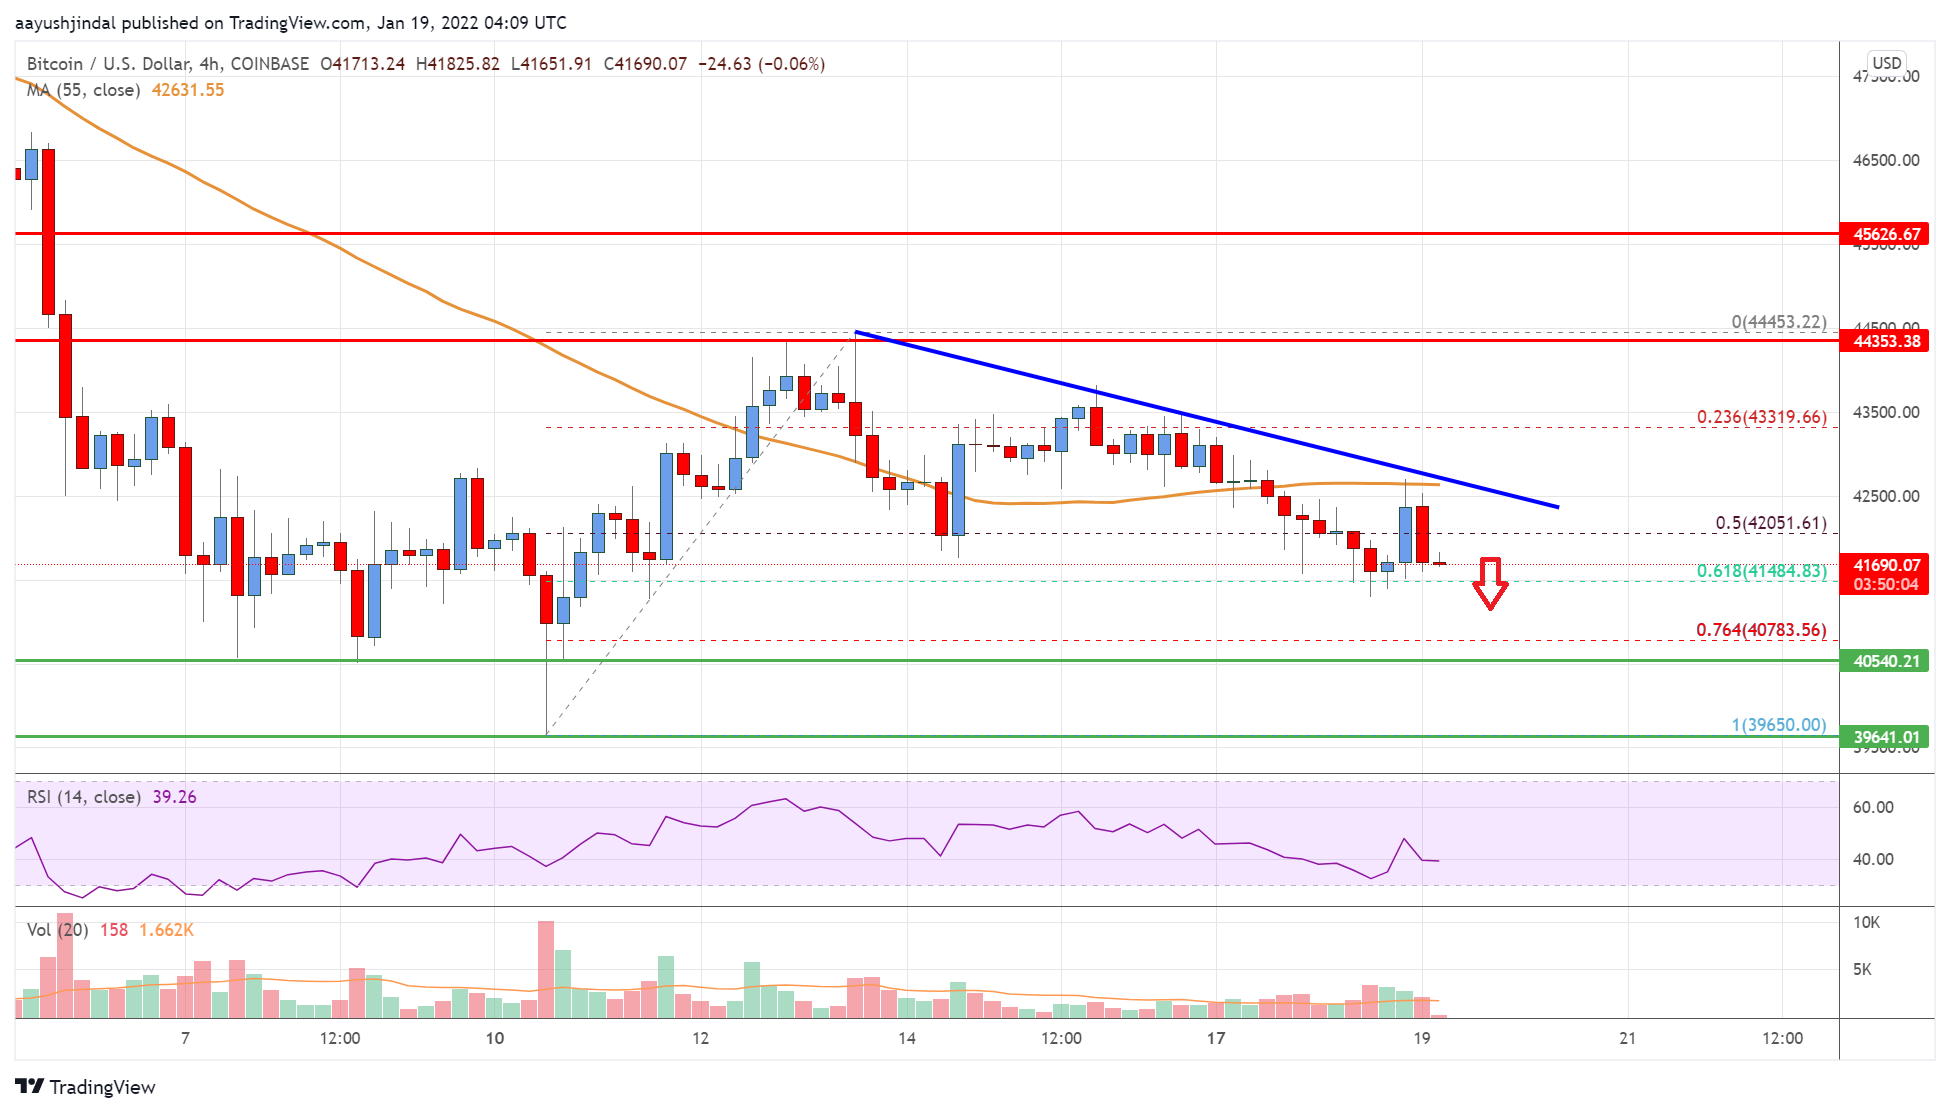
Bitcoin price started a fresh decline from the $44,500 resistance. BTC traded below the $44,000 and $43,200 support levels to move again into a bearish zone.
There was also a move below the $43,000 level. The bears pushed the price below the 50% Fib retracement level of the upward move from the $39,650 swing low to $44,453 high. The price is now trading below $43,000 and the 55 simple moving average (4-hours).
There is also a key bearish trend line forming with resistance near $42,600 on the 4-hours chart of the BTC/USD pair. An immediate support on the downside is near the $41,500 level.
It is near the 61.8% Fib retracement level of the upward move from the $39,650 swing low to $44,453 high. The next key support is near the $40.800 level. If the price fails to stay above $40,800, it could extend losses in the near term.
The next major support sits near $40,800, below which there is a risk of a move towards the $40,000 level. On the upside, an initial resistance is near the $42,500 level and the trend line. A clear upside break above the trend line might push the price towards $43,300.
The next major resistance on the upside is near the $44,500 level. To start a strong increase, the price must settle above the $44,500 level in the near term.
Looking at the chart, bitcoin price is clearly trading below $44,000 and the 55 simple moving average (4-hours). Overall, the price could start a strong upward move if there was a break above the $43,000 resistance.
Technical Indicators
4 hours MACD – The MACD is now losing momentum in the bearish zone.
4 hours RSI (Relative Strength Index) – The RSI is now below the 50 level.
Key Support Levels – $41,500 and $40,800.
Key Resistance Levels – $42,500, $43,000 and $44,500.


Leave a Reply
You must be logged in to post a comment.