- Bitcoin cash gained pace above the $100 and $110 resistance levels against the US Dollar.
- The price is now trading above the $110 zone and the 55 simple moving average (4-hours).
- There is a key bullish trend line forming with support near $110 on the 4-hours chart of the BCH/USD pair (data feed from Coinbase).
- The pair must clear $120 and $122 to continue higher in the near term.
Bitcoin cash price is climbing above $110 against the US Dollar, similar to bitcoin. BCH/USD could start a fresh surge if it clears the $120 level.
Bitcoin Cash Price Analysis
Bitcoin cash price formed a decent support base above the $95 level. BCH started a recovery wave and was able to clear the $100 resistance zone.
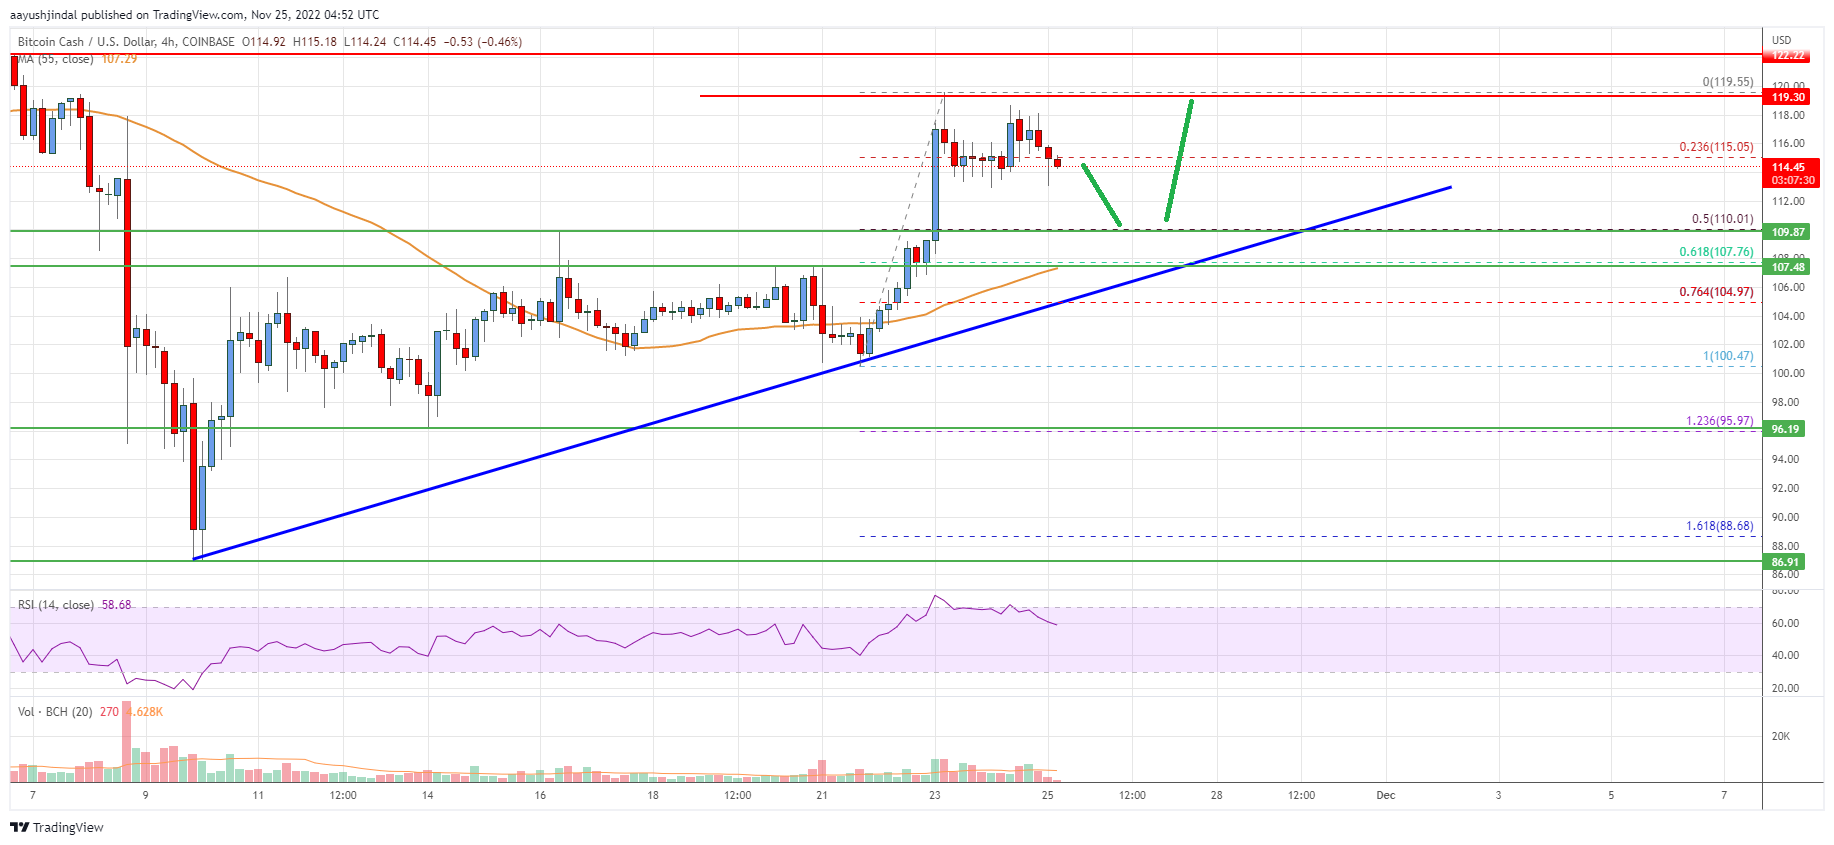
The price climbed above the $110 and $112 resistance levels. However, the price struggled to clear the $120 resistance zone. It traded as high as $119.5 before it started consolidating gains. The price is now trading above the $110 zone and the 55 simple moving average (4-hours).
There was a move below the 23.6% Fib retracement level of the upward move from the $100 swing high to $119.5 high. An immediate support on the downside is near the $112 level.
The first major support sits near the $110 level. There is also a key bullish trend line forming with support near $110 on the 4-hours chart of the BCH/USD pair. The trend line is near the 50% Fib retracement level of the upward move from the $100 swing high to $119.5 high.
The next major support is near $107 and the 55 simple moving average (4-hours), below which the bears might aim $100. The next target for them may perhaps be near the $95 level.
On the upside, the price is facing resistance near the $120 level. The next major resistance is near the $122 level, above which the price may perhaps rise towards the $125 level. Any more gains above $122 and $125 could set the pace for a move towards the $135 level in the coming days.

Looking at the chart, bitcoin cash price is now trading above the $110 zone and the 55 simple moving average (4-hours). Overall, the price must clear $120 and $122 to continue higher in the near term.
Technical indicators
4 hours MACD – The MACD for BCH/USD is slowly losing pace in the bullish zone.
4 hours RSI (Relative Strength Index) – The RSI for BCH/USD is above the 50 level.
Key Support Levels – $110 and $107.
Key Resistance Levels – $120 and $122.


Leave a Reply
You must be logged in to post a comment.