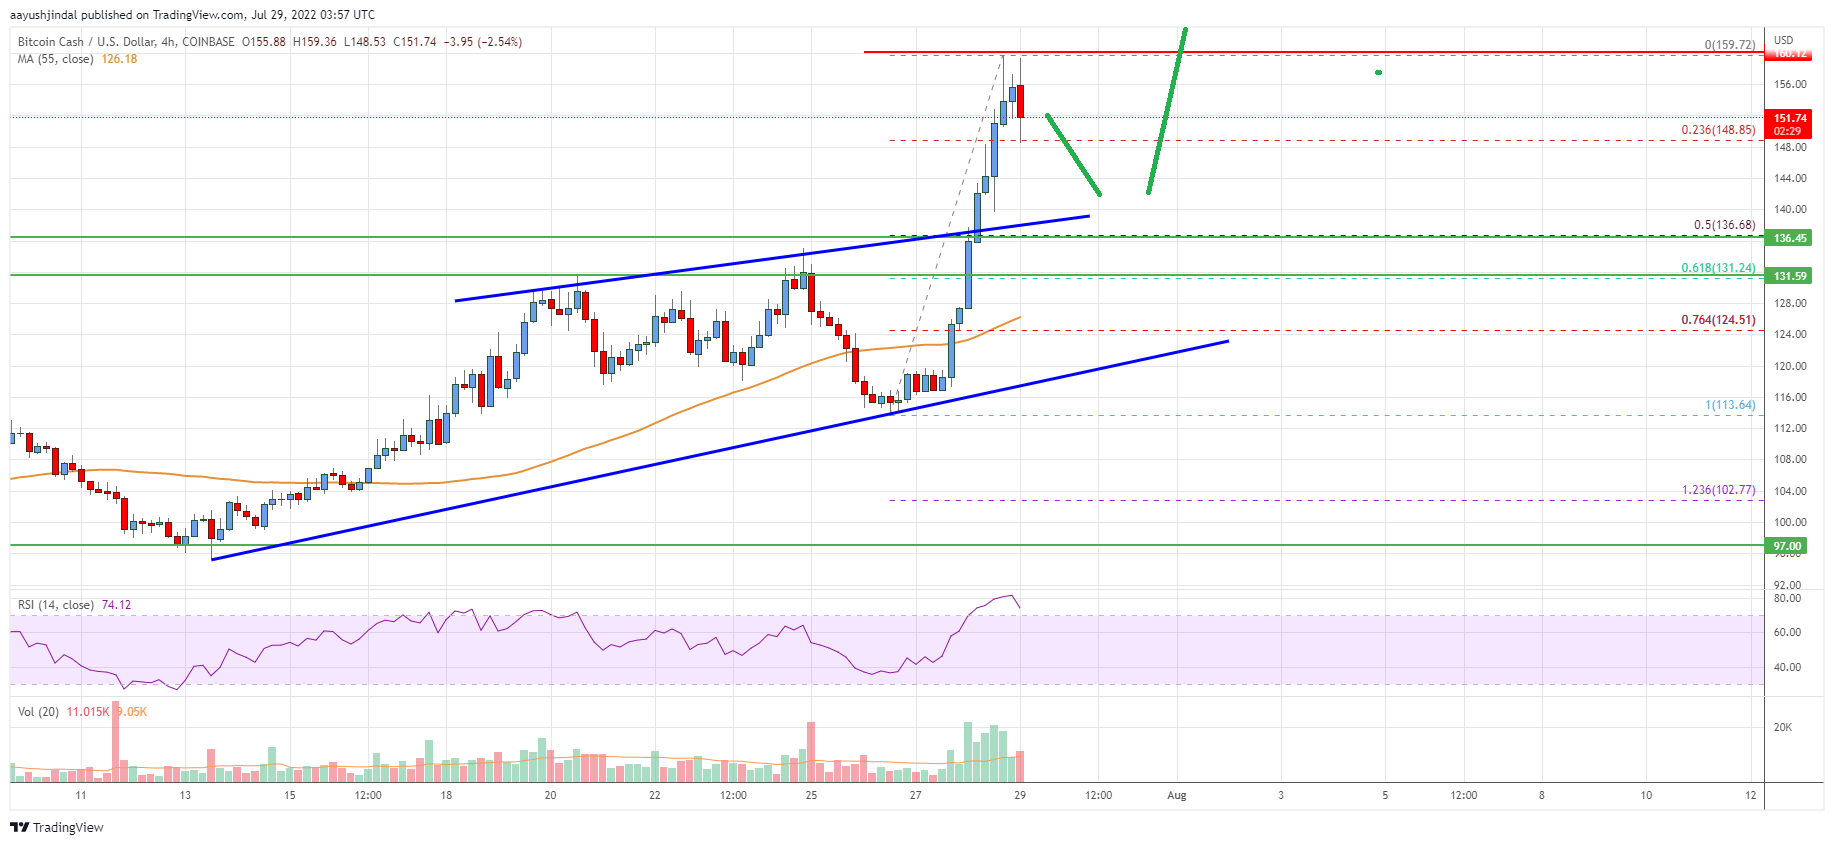
- Bitcoin cash price started a fresh increase from the $112 zone against the US Dollar.
- The price is now trading above the $140 zone and the 55 simple moving average (4-hours).
- There was a break above a key rising channel with resistance near $140 on the 4-hours chart of the BCH/USD pair (data feed from Coinbase).
- The pair must clear $160 and $165 to continue higher in the near term.
Bitcoin cash price is climbing above $140 against the US Dollar, similar to bitcoin. BCH/USD could start a fresh surge if it clears the $160 level.
Bitcoin Cash Price Analysis
Bitcoin cash price formed a decent support base above the $112 level. BCH started a fresh increase and was able to clear the $120 resistance zone.
The price climbed above the $130 and $132 resistance levels. There was a break above a key rising channel with resistance near $140 on the 4-hours chart of the BCH/USD pair. It even broke the $150 level and the 55 simple moving average (4-hours).
It traded as high as $159.42 and is currently consolidating gains. There was a move below the $155 support. The pair tested the 23.6% Fib retracement level of the recent wave from the $113 swing low to $159 high.
An immediate resistance is near the $158 level. The first major resistance is near the $160 level. Any more gains above $158 and $160 could set the pace for a move towards the $170 level. If there is a move above the $170 resistance, the price could rise towards the $180 zone.
An immediate support on the downside is near the $148 zone. The next major support is near the $140 level, below which the bears might aim $138 or the 50% Fib retracement level of the recent wave from the $113 swing low to $159 high. The next target for them may perhaps be near the $125 level.

Looking at the chart, bitcoin cash price is now trading above the $140 zone and the 55 simple moving average (4-hours). Overall, the price must clear $160 and $165 to continue higher in the near term.
Technical indicators
4 hours MACD – The MACD for BCH/USD is gaining pace in the bullish zone.
4 hours RSI (Relative Strength Index) – The RSI for BCH/USD is well above the 50 level.
Key Support Levels – $148 and $140.
Key Resistance Levels – $158 and $160.


Leave a Reply
You must be logged in to post a comment.