
- Bitcoin cash price is gaining pace above the $225 and $230 resistance levels against the US Dollar.
- The price is now trading above the $232 resistance and the 55 simple moving average (4-hours).
- There was a break above a key bearish trend line with resistance at $230 on the 4-hours chart of the BCH/USD pair (data feed from Coinbase).
- The pair is likely to accelerate higher if it clears the $238 and $240 resistance levels in the near term.
Bitcoin cash price is showing positive signs above $230 against the US Dollar. BCH/USD is likely to continue higher unless it dives below $225 and $220.
Bitcoin Cash Price Analysis
This week, bitcoin cash price formed a strong support base above the $215 level against the US Dollar. BCH price started a fresh increase above the $220 resistance and gained pace above the 55 simple moving average (4-hours).
The price rallied above the $230 resistance to move into a positive zone. There was also a break above a key bearish trend line with resistance at $230 on the 4-hours chart of the BCH/USD pair.
Bitcoin cash price traded as high as $238 and it is currently consolidating gains. An initial support is near the $232 level. It is also close to the 23.6% Fib retracement level of the recent upward move from the $215 swing low to $238 high.
The first major support is near the broken trend line and $227. The 50% Fib retracement level of the recent upward move from the $215 swing low to $238 high is also near the $227 level. The main support is now near the $225 level, below which the price could retest the $215 support.
On the upside, an initial resistance is near the $238 level, above which the price might rise above $240. In the stated case, the price is likely to rise steadily towards the $250 level. The next major resistance is near the $265 level.
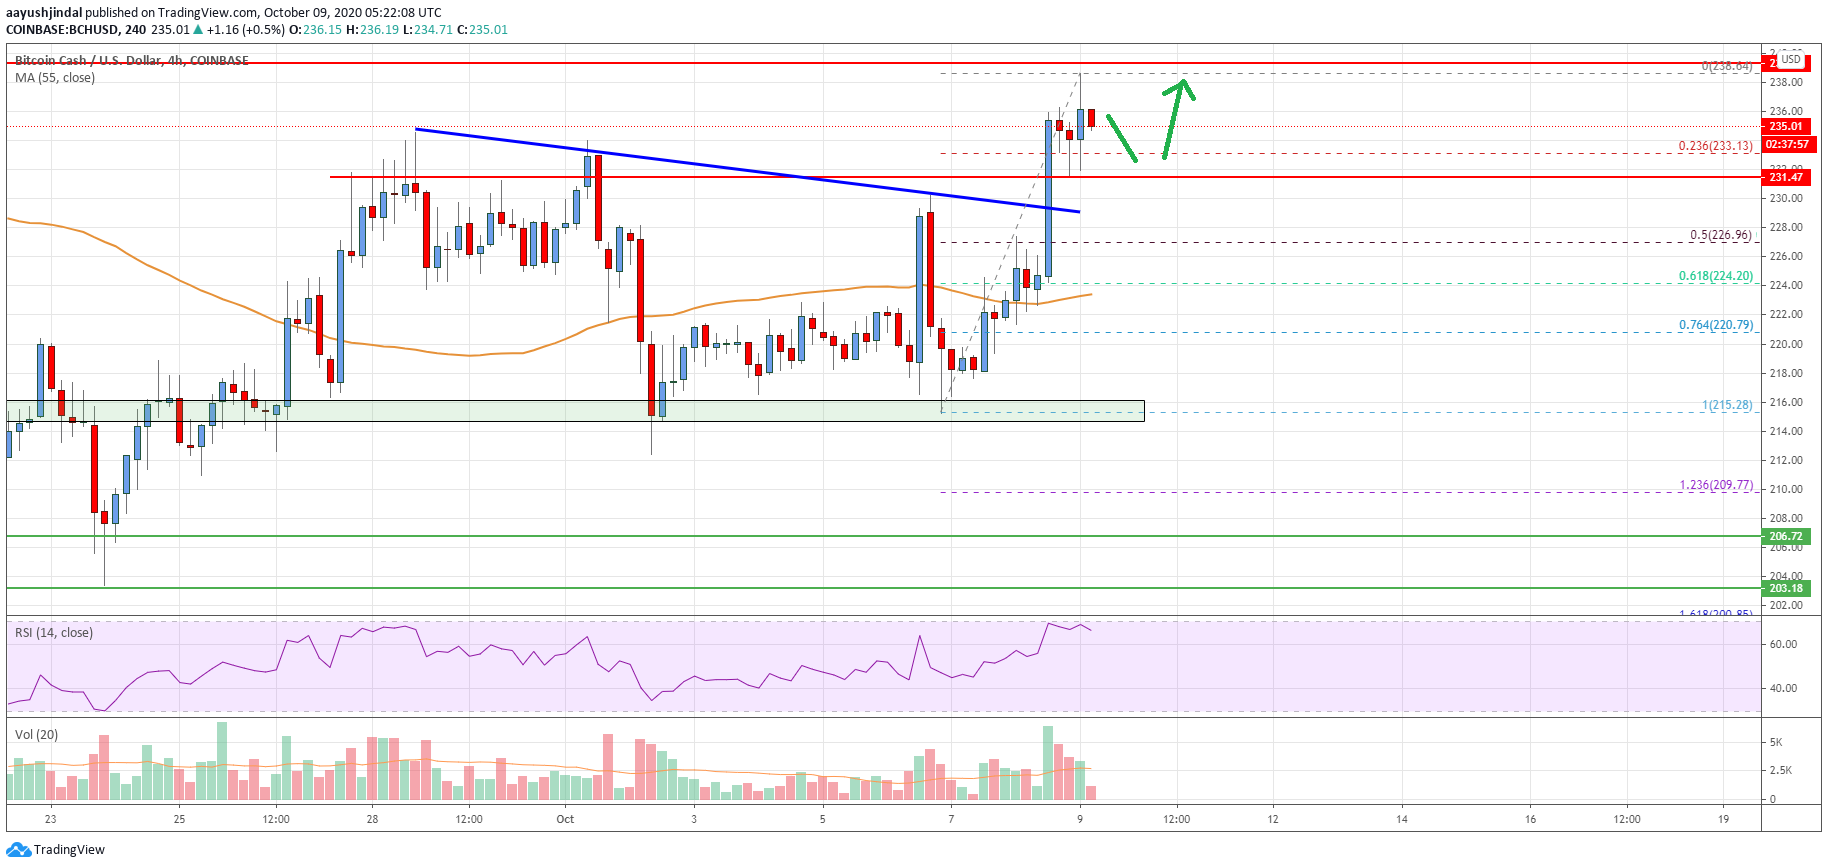
Looking at the chart, bitcoin cash price is clearing gaining pace above the $225 and $230 resistance levels. The price is likely to accelerate higher if it clears the $238 and $240 resistance levels in the near term.
Technical indicators
4 hours MACD – The MACD for BCH/USD is slowly losing momentum in the bullish zone.
4 hours RSI (Relative Strength Index) – The RSI for BCH/USD is now well above the 60 level.
Key Support Levels – $232 and $225.
Key Resistance Levels – $238 and $240.


Leave a Reply
You must be logged in to post a comment.