- Bitcoin cash price failed to clear the $235 resistance and declined sharply against the US Dollar.
- The price is now trading near the key $220 support and the 55 simple moving average (4-hours).
- There was a break below a crucial bullish trend line with support near $227 on the 4-hours chart of the BCH/USD pair (data feed from Coinbase).
- The pair could either continue lower towards $200 or it might recover from the $220 support.
Bitcoin cash price is struggling to hold gains above $220 against the US Dollar. BCH/USD must stay above $220 to avoid more losses towards $200 in the near term.
Bitcoin Cash Price Analysis
This week, bitcoin cash price managed to start an upside correction above the $220 pivot level against the US Dollar. BCH price even settled above the $220 pivot level and the 55 simple moving average (4-hours).
However, the bulls failed again to clear the $235 resistance zone. A high is formed near $235 and the price declined sharply below $230. There was a break below the 23.6% Fib retracement level of the upward move from the $203 swing low to $235 high.
More importantly, there was a break below a crucial bullish trend line with support near $227 on the 4-hours chart of the BCH/USD pair. The pair is now testing the $220 support level and the 55 simple moving average (4-hours).
The 50% Fib retracement level of the upward move from the $203 swing low to $235 high is also near the $220 level to provide support. If there is a downside break below the $220 support, there is a risk of another sharp decline.
The next major support is near the $206 level, below which the price may even break the $203 and $200 support levels in the near term. Conversely, the price might recover from the $220 support.
An initial resistance is near the $225 level, above which the price might rise above $230. The main resistance is still near the $235 level, above which the price could rally towards the $250 level.
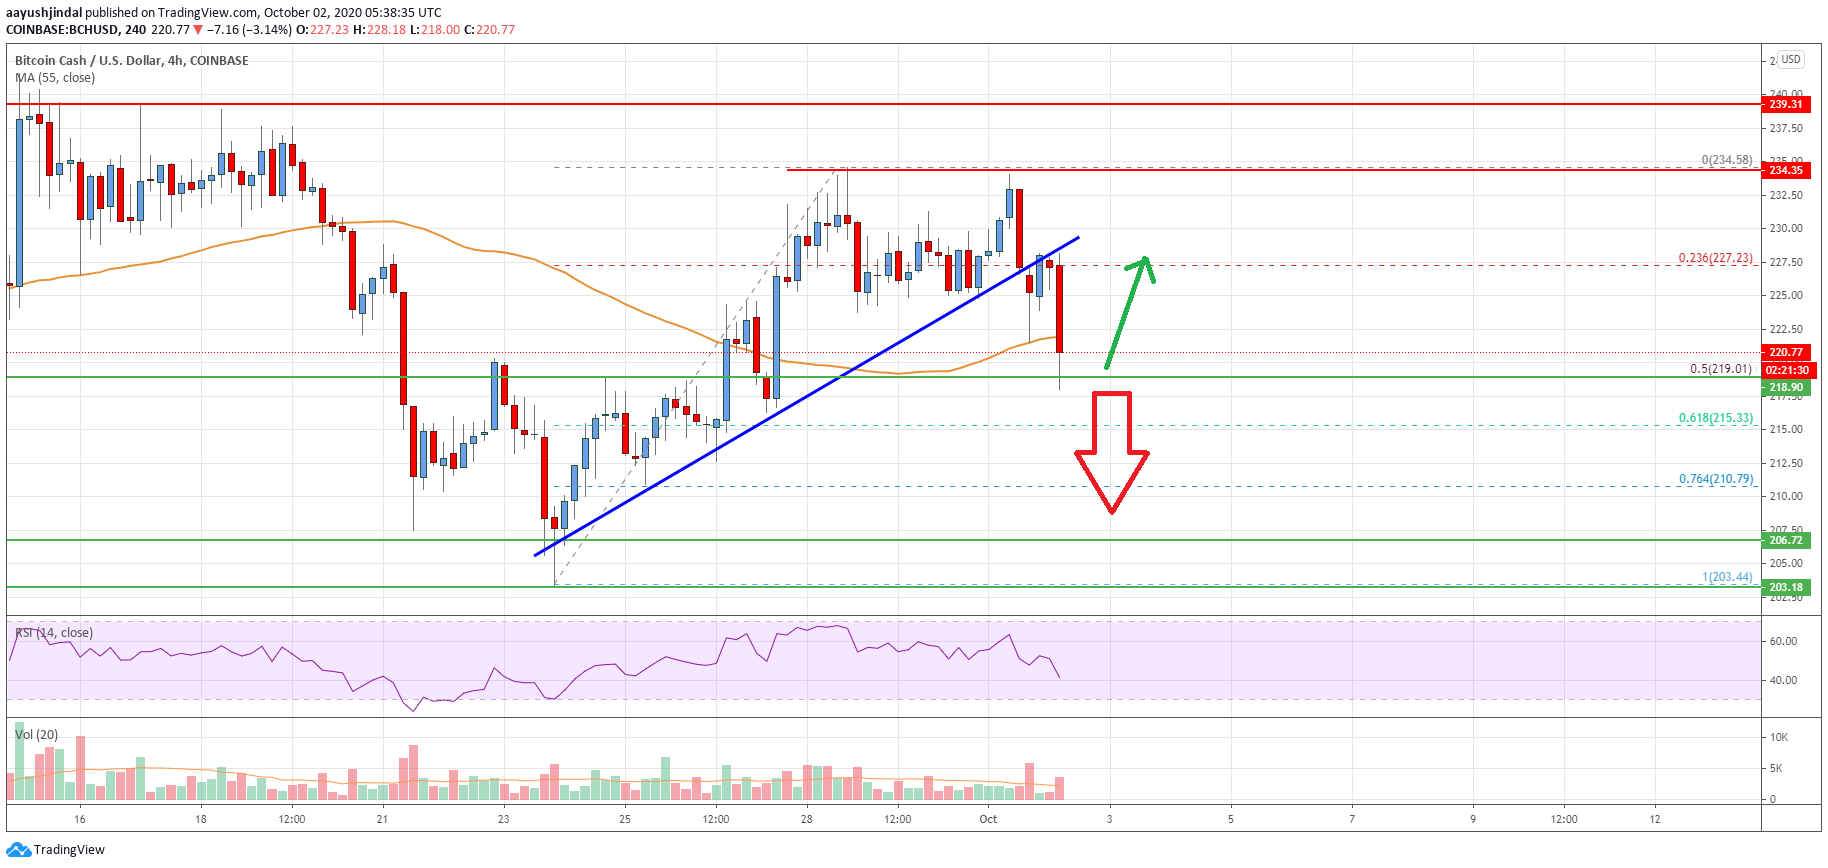
Looking at the chart, bitcoin cash price is trading near the key $220 support and the 55 simple moving average (4-hours). The price could either continue lower towards $200 or it might recover from the $220 support.
Technical indicators
4 hours MACD – The MACD for BCH/USD is now gaining pace in the bearish zone.
4 hours RSI (Relative Strength Index) – The RSI for BCH/USD is now well below the 50 level.
Key Support Levels – $220 and $206.
Key Resistance Levels – $225 and $235.


Leave a Reply
You must be logged in to post a comment.